


ROIC, Reinvestment Rate, Intrinsic Value Growth
The essence of long-term compounding

Today, we’re taking another look at ROIC—this time focusing on the reinvestment rate and how it drives long-term growth.

I’ve written about ROIC before, but in this piece, I aim to break down its most critical aspect—returns on capital combined with the level of reinvestment—in the simplest way possible. This is something I only recently came to fully appreciate myself. Writing helps me sharpen my understanding, which is one of the reasons I love Substack.
What You’ll Read Today
ROIC Recap
Reinvestment Rate
Intrinsic Value Growth
ROIC Recap
Before jumping into reinvestment, let’s quickly recap ROIC.
The return a company earns on its capital is one of the biggest drivers of shareholder value. If a company’s ROIC falls below its cost of capital (the opportunity cost of investing elsewhere), it’s actively destroying value—even if it’s still profitable.
ROIC is calculated as:
Where:
NOPAT (Net Operating Profit After Tax) represents the company’s after-tax operating income.
Invested capital includes net working capital and non-current operating assets.
Here’s a simple example: Imagine a company owns a factory worth $100 and earns $20 in NOPAT, giving it a 20% ROIC. If the cost of capital is 10%, reinvesting against similar returns makes sense—every dollar reinvested earns more than the opportunity cost.
Now, let’s say the same factory only generates $5 in NOPAT, meaning its ROIC is just 5%, while the opportunity cost remains 10%. In this case, reinvesting against those returns destroys value. Investors would be better off allocating their capital elsewhere.
But high ROIC alone isn’t enough to drive strong shareholder returns over time. Our 20% ROIC factory must continuously find ways to reinvest earnings at similarly high rates. It’s not just about reinvesting—it’s about deploying capital into opportunities that sustain those high returns.
Importantly, even a 20% ROIC business can destroy value if its incremental investments generate low returns, while a 5% ROIC business can create value if it finds high-return reinvestment opportunities.
Reinvestment Rate
If a company stops reinvesting, growth typically slows. Seems obvious, but let’s break it down.
Take our factory example. Suppose it has a reinvestment rate of 10% and can deploy that capital at a 20% return. This means its return on incremental invested capital (ROIIC) is 20%, keeping ROIC steady at 20%. Since only 10% of NOPAT is reinvested, growth is slow.
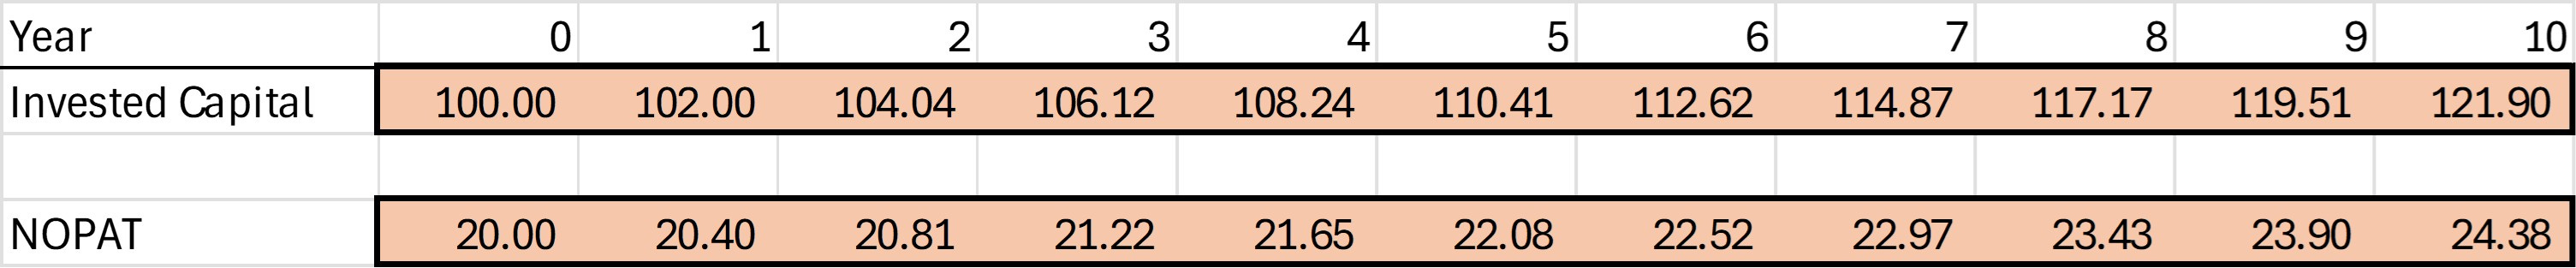
As an investor, you'd likely receive dividends, but they wouldn't fully compensate for the slow growth (which you’ll see in a moment).
Now, what if the company reinvests 100% of its earnings into opportunities with the same 20% ROIIC?
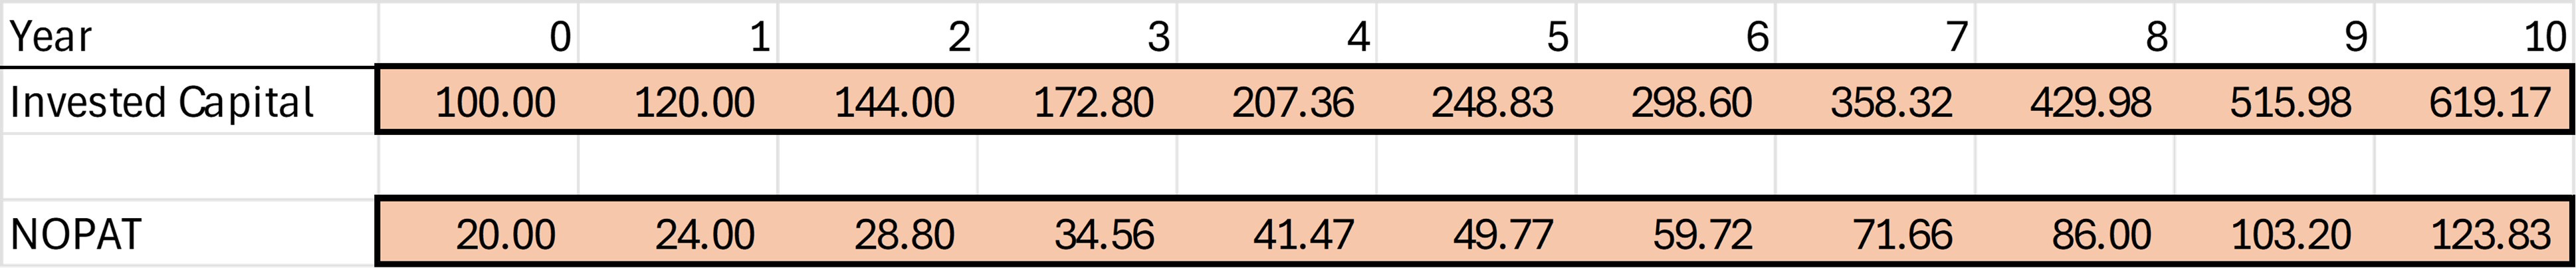
The difference is massive. Instead of reaching $24 in NOPAT after 10 years, the factory now generates $124!
With a price multiple of 15x, the share price in the first scenario would be $366 (24.38 x 15). In the second scenario, it jumps to $1,858 (123.83 x 15). Even after adding up all dividends from the first case, amounting to $219, it’s clear that reinvesting into high-return opportunities is almost always better than handing out most of the earnings as dividends.
But how do we calculate the reinvestment rate?
The formula is:
Or, put simply, it’s the portion of profit reinvested through capex and working capital. Depreciation is subtracted to reflect maintenance capex.
A more straightforward approach is:
This method looks at how much capital was added over time relative to total earnings available for reinvestment.
For example, Costco’s invested capital grew from $13.6 billion in 2014 to $28.4 billion in 2024, while its cumulative NOPAT was $44.7 billion.
You can also measure the reinvestment rate yearly by using that year’s NOPAT and change in invested capital. Averaging it over multiple years, however, generally provides a clearer picture.
Intrinsic Value Growth
Once you know both the reinvestment rate and ROIIC, you can estimate how fast a company’s intrinsic value should compound over time.
Costco’s reinvestment rate over the period was 33%, and its ROIIC was also 33%.
Multiplying the two gives an expected growth rate of 11%, suggesting Costco’s intrinsic value should compound at roughly 11% per year.
In reality, Costco’s stock price compounded at a much higher rate. Why? This formula doesn’t account for dividends and share buybacks. The 67% of NOPAT that wasn’t reinvested was likely returned to shareholders, further boosting returns.
Alternatively, the stock could be overvalued today—but I wouldn’t rely on this metric alone for a valuation call. Besides, this is a rough estimate of a company’s intrinsic value growth, which isn’t the same as its stock price.
A high return on invested capital, combined with high levels of reinvestment, can fuel spectacular growth. That brings me to one of Warren Buffett’s best quotes:
“Leaving the question of price aside, the best business to own is one that over an extended period can employ large amounts of incremental capital at very high rates of return.”
That perfectly sums up the entire idea.
I hope this breakdown clarified the link between ROIC, reinvestment rate, and growth. It certainly has for me. I truly believe this is the foundation of long-term value creation—or, simply put, compounding.
In case you missed it:
Disclaimer: the information provided is for informational purposes only and should not be considered as financial advice. I am not a financial advisor, and nothing on this platform should be construed as personalized financial advice. All investment decisions should be made based on your own research.
hello this is interesting content! could you make maybe an article with a concrete example (costco?) Also with real calculation of ROIIC since ROIIC is not explained? maybe also with the remarks of Absolute Total compound explained in the calculation? this would be great and interesting for the less financial eductated like myself tx
Thanks for this one, great explanations. Always good to review these vital components.