
Michael Mauboussin's Guide to Measuring a Company's Moat
Industry analysis, Porter's five forces, company analysis, and a checklist to make your life easier

A wide moat, a strong moat, a deep moat. Or a narrow moat, a small moat, or no moat at all. It’s all a bit abstract, isn’t it? If both Amazon and Microsoft have a wide moat, how do you determine which company has the better moat?
How do you actually measure a moat?

To answer that, I’m turning once again to Michael Mauboussin’s work. Yes, I reference him often, but that’s because I believe his approach to investing is one of the best.
Today’s post breaks down Measuring the Moat, a 2024 article by Mauboussin and Dan Callahan, where they lay out a comprehensive checklist for analyzing a company’s moat.
What You’ll Read Today
Industry Analysis
Forces and Barriers
Disruption
Company Analysis
Checklist
Industry Analysis
For a company to sustain high returns on invested capital (ROIC) over time, it needs a wide moat—durable competitive advantages that allow it to earn more than its cost of capital (WACC). Therefore, a positive spread between ROIC and WACC is a good indicator of a moat.
But a high spread doesn’t necessarily mean a company is strong. The industry itself plays a major role in determining returns. Some industries, like household products, naturally have higher average returns than others, such as communications equipment.
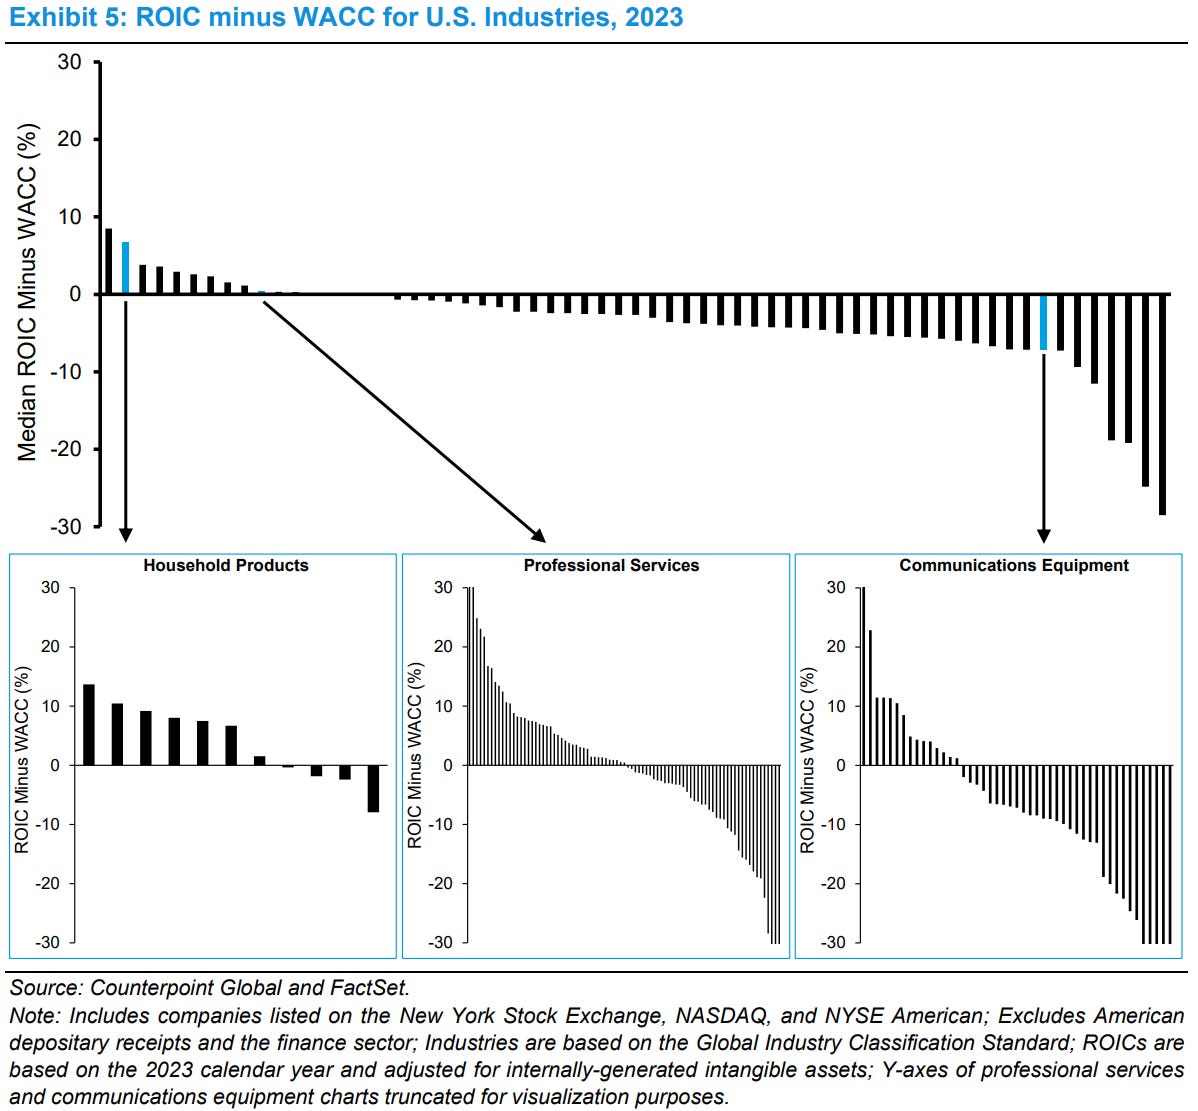
That doesn’t mean investing in a low-return industry is always a bad idea. As seen in the image above, there’s often a wide variance within industries, and many companies in “bad” industries still generate strong returns.
This variance in spreads can be traced back to four factors:
Macroeconomic environment
Industry dynamics
Company-specific characteristics
Leadership
Because industry conditions shape a company’s returns, assessing the broader industry landscape is important. This includes analyzing profit distribution, stability, and the type of industry.
Mauboussin and Callahan recommend constructing an industry map to get a broad sense of the competitive landscape. This should include all relevant players—competitors, suppliers, customers, governments, and external factors like geopolitical risks.
Beyond mapping the industry, an industry profit pool helps investors see where value is being created. The example below illustrates the US airline industry. Here:
The Y-axis represents the ROIC-WACC spread.
The X-axis represents invested capital per company.
The area of each company represents its economic profit.

In this example, the airline industry shows high volatility over the years, with profits constantly shifting between companies. This brings us to another important aspect of industry analysis: stability.
Stability allows companies to consistently create value. Industries with frequent disruptions—whether from new entrants, technological shifts, changing consumer preferences, or aggressive pricing—are riskier.
One way to measure market stability is by tracking changes in market share. This can be done by comparing companies’ market shares (in units sold, searches, clicks, etc.) over two time periods and calculating the average change.
Mauboussin and Callahan highlight several industries:
Search Engines
Very stable from 2018 to 2023, with Google maintaining dominance.
Auto Manufacturing
Also stable despite the high number of competitors.
Web Browsers
Less stable, with Chrome and Safari gaining market share.
Social Media
Unstable, with many different platforms and shifting user preferences.
As a rule of thumb, an average change of 2% or more suggests industry instability.
Alongside stability, industry concentration is important. Highly concentrated industries suggest limited competition, strong barriers to entry, and greater pricing power, typically making them more attractive. Think Visa/Mastercard, Coca-Cola/Pepsi, iOS/Android, etc.
Finally, it’s important to define the type of industry a business operates in. Mauboussin and Callahan outline six distinct industry structures, each with unique strategic opportunities.

Forces and Barriers
Now that you’ve a better understanding of an industry, the next step is to analyze its profitability, particularly through the lens of Michael Porter’s five-forces framework. Mauboussin and Callahan stress that the goal is not to determine whether an industry is attractive, but to understand the key drivers of profitability. Moreover, a company’s strategy should not be focused on beating competitors, but rather on finding ways to earn a sustainable economic profit.
Porter’s five forces are:
Bargaining Power of Suppliers
This refers to the leverage suppliers have over price, quality and service. An industry with many suppliers and low switching costs is generally more favorable. Suppliers have more power when their products are essential, particularly when their offerings represent a small percentage of the buyer’s total costs.
Companies can mitigate supplier power by diversifying its supplier base and through vertical integration.
Bargaining Power of Buyers
Buyers gain power when there are few of them, switching costs are low, they are well informed, and substitute products exist. When buyers don’t heavily depend on a product or service, or when alternatives are easily available, their bargaining power increases.
Businesses can offset buyer power by differentiating and promoting customer loyalty.
Threat of Substitutes
The threat of substitutes arises when there are alternatives that customers can easily switch to. If substitutes are available and appealing, they limit a company’s pricing power and put a limit on potential returns.
Companies can offset the threat of substitutes by innovating, improving their products, and by creating switching costs.
Threat of New Entrants
This one is critical, and Mauboussin and Callahan discuss it in detail. The level of threat posed by new entrants depends on the barriers to entry. Low barriers encourage high entry and exit rates, leading to instability and unsatisfactory returns. When returns are high across an industry, new entrants tend to flood the market until profits fall, after which they exit. This is what leads to reversion to the mean.
High barriers to entry discourage new competition and can include factors like:
Capital requirements
Established brand strength and customer loyalty
Access to distribution channels
Economies of scale
Switching costs
Regulation
Rivalry Among Existing Firms
Intense rivalry is typically detrimental to profitability. When companies aggressively compete through pricing, service differentiation, capacity changes, new products, advertising, or promotions, it can create a prisoner’s dilemma, where each firm would be better off if all didn’t aggressively compete.
Industries with large numbers of equally sized competitors, all vying for market share, should generally be avoided.
Disruption
Disruption is one of the greatest enemies of long-term investors. Mauboussin and Callahan in particular talk about “disruptive innovation”, or an innovation that serves the same market but with a different business model, often simpler and cheaper. Netflix disrupting Blockbuster is the classic example.
Disruptions like these are dangerous because, at first glance, they don’t seem dangerous. When Netflix delivered DVDs to customers, their profitability was much lower than Blockbuster’s. Blockbuster chose to ignore this new entrant, because why would you, as a highly profitable and established leader, enter a worse business?
Until Netflix grew bigger and bigger, and introduced streaming, when ignoring this disruption was not possible anymore. By then, it was too late for Blockbuster.
One might wonder if Google Search is today’s Blockbuster, with its highly profitable ad revenue, but that’s a different topic entirely.
Ignoring disruptors seems sensible from the point of view of the disrupted, until it’s too late.
Industries are susceptible to disruptive innovation if:
They overserve customers, offering more features or performance than needed, creating opportunities for simpler, lower-cost alternatives.
A simpler, more accessible solution could attract new customers.
Technology enables similar performance at lower prices.
A low-cost business model can gain traction.
Company Analysis
Value creation at the company level is based on four concepts:
Willingness to Pay (WTP)
The maximum price a customer is willing to pay.
Price
The amount the customer actually pays.
Cost
The expense incurred to produce and sell a product.
Willingness to Sell (WTS)
The minimum price at which a supplier is willing to sell its products.

Long-term value creation requires not only generating value for the firm but also for consumers (by pricing below their WTP) and suppliers (by keeping costs above their WTS). This means companies can create value not just by raising prices and lowering costs but also by increasing WTP and decreasing WTS—giving themselves more room to capture value.
You know that feeling when you get a deal so good it feels like you’re ripping off the seller? That’s the gap between price and your WTP. Conversely, if a supplier feels like they’re getting a great deal, it means their WTS is much lower than the price they’re receiving.
Increasing Willingness to Pay (WTP)
Mauboussin and Callahan outline several ways companies can increase WTP:
Network Effects
Products or services become more valuable as more people use them, translating into a higher WTP.
Complements
When two products are consumed together, one can increase the WTP for the other. Amazon, for example, sells both Kindle devices and e-books.
Other Factors
Products or services that enhance status, reduce search costs, create habits, or impose high switching costs all increase WTP. Luxury brands command premiums for exclusivity, while Amazon.com’s recommendations reduce search costs.

Lowering Willingness to Sell (WTS)
Lowering WTS—whether for suppliers or employees—allows a company to reduce costs without compromising relationships. There are some of the methods:
Lowering Supply Costs
Companies can lower supply costs in several ways. Mauboussin and Callahan highlight data sharing as one example—by providing suppliers with insights on sales trends, regional demand, and price elasticity, companies help them optimize inventory and production, reducing costs and WTS.
Other methods include leveraging trademarks, patents, licenses, operating rights, and strategic geographic positioning.
Improving Productivity
Increasing productivity lowers the need for inputs to generate the same output as competitors. Productivity gains may take different forms:
High-quality management
Moving up the learning curve
Manufacturing complexity (I immediately think of ASML)
Working capital management
Employee Relations
Employees, considered suppliers of labor, are often the largest expense for a company. Employees’ WTS can be lowered by increasing satisfaction, which can be done by establishing a workplace culture that fosters intrinsic motivation—through autonomy, mastery, and purpose.
Mauboussin and Callahan also examine how brands influence WTP and WTS. Brands that confer status drive higher WTP—consumers willingly pay more for a Tiffany engagement ring than a Costco equivalent. However, brand familiarity alone isn’t enough; consumers must perceive it as worth the premium.
Strong brands can also lower WTS if suppliers see value in the association. For example, Walmart’s retail presence is so powerful that suppliers may offer discounts just to secure shelf space.
Checklist
I realize analyzing a company’s moat can be a lot of work, but fortunately, so did Mauboussin and Callahan. They included a convenient, though still very detailed, checklist at the end of the article.
I have made a more concise checklist which you may find useful:
Industry Analysis
Does the company earn an ROIC above its WACC?
Is the ROIC stable, growing, or declining?
What is the industry’s ROIC and trend?
How is the industry concentrated, and how stable is the industry?
How do companies interact with one another?
Forces and Barriers
Can the company pass on price increases from suppliers? How dependent is the company on key suppliers?
Are customers price-sensitive? How informed are they?
Are there substitute products?
What is the history of entry and exit in the industry? Are barriers to entry high?
Are there scale benefits, network effects, or regulatory protection?
Disruption
Is the industry susceptible to disruptive innovation?
Company Analysis
Does the company actively increase WTP? Does the company raise prices without improving the offering?
Does the company actively lower WTS?
Does the brand increase WTP or lower WTS?
If you’re interested in the complete checklist, or the entire article, you can find it here:
There’s a lot more information I haven’t discussed that I’m sure you’ll find interesting.
In case you missed it:


Disclaimer: the information provided is for informational purposes only and should not be considered as financial advice. I am not a financial advisor, and nothing on this platform should be construed as personalized financial advice. All investment decisions should be made based on your own research.
Having a checklist is absolutely essential—an excellent way to honor Charlie Munger.
Lots of helpful concepts here, thanks.