
Common Errors in DCF Models From Michael Mauboussin
The forecast period, investments and growth, double counting, and more

Today, I want to share insights from a fascinating article by Michael Mauboussin, where he breaks down the most common mistakes in DCF models—and, more importantly, how to fix them.

Mauboussin opens with a great quote from Valuation: Measuring and Managing the Value of Companies:
“Discounted cash flow analysis is the most accurate and flexible method for valuing projects, divisions, and companies. Any analysis, however, is only as accurate as the forecasts it relies on. Errors in estimating the key ingredients of corporate value . . . can lead to mistakes in valuation.”
At its core, investing is about forecasting cash flows. We analyze a business—how it makes money, its competitive advantages, management quality, margins, returns on capital, and more—all to build a clearer picture of future cash flows.
Yet this process is often either overlooked or done poorly (I’m guilty as well). Many investors dismiss DCF analysis as a waste of time because, in the end, you’re always going to be wrong. And yes, DCFs rely on many assumptions. But the goal is about being less wrong than others (the market) and using assumptions you understand and are comfortable with.
In his article, Mauboussin highlights the most common errors in DCF models. We’ll go through his list and see how we can refine our own approach.
What You’ll Read Today
Explicit and Implicit Value
Investments and Growth
Double Counting
Scenarios
DCF Model For Costco
Explicit and Implicit Value
Mauboussin opens his list of common DCF errors with a crucial mistake—one that was relevant when he wrote it in 2006 and remains just as widespread today.
Many investors build DCF models with overly short forecast periods (the explicit period). A typical DCF projects free cash flows for only 5-10 years, after which a terminal value is stuck to the end. This approach is popular because forecasting further into the future feels too uncertain.
But this doesn’t make sense for two key reasons:
1. The Market is Forward-Looking
Stock prices reflect expectations of profits far into the future. For example, a company trading at a P/E ratio of 30 suggests the market values its earnings as if they’ll continue for decades. Why, then, would a DCF only forecast five years ahead?
This ties into a broader issue: some investors rely almost only multiples like the P/E ratio to make decisions. While useful for quick scans and spotting extreme mispricings, multiples are fundamentally flawed as a primary valuation method. They:
Oversimplify valuation and ignore key value drivers
Depend heavily on market sentiment and current stock prices
Can be distorted by accounting differences
Fail to explicitly capture future cash flows
Multiples should be used carefully and not as a primary valuation method.
“Some investors swear off the DCF model because of its myriad assumptions. Yet they readily embrace an approach that packs all of those same assumptions, without any transparency, into a single number: the multiple.”
2. Short Forecasts Distort Terminal Value
When the explicit period is too short, the terminal value ends up carrying most of the valuation—which makes little sense. The terminal value should capture cash flows far into the future, while the explicit forecast should drive the core of the valuation.
I see this mistake most often when investors try to value companies with long competitive advantage periods—businesses with durable moats. Take Microsoft, for example. If a DCF only projects five years of cash flows, the model will almost always make Microsoft look overvalued, because the stock price reflects way more than just those initial years.
So how should we look at the forecast period and terminal value? Mauboussin argues that most DCF models’ terminal values are uneconomic—they fail to account for the natural reversion of returns of capital toward the mean.
In fact, most investors don’t tie growth to reinvestment in their models at all, which we’ll discuss hereafter.
The explicit forecast period should last as long as the company continues generating excess returns on new investments (ROIIC). Once ROIIC declines toward the cost of capital, the forecast period should end, and the remaining value should be captured in the terminal value.
Pretty interesting in my opinion. Ask yourself: Do you really believe a company like Microsoft will stop generating high returns on new investments in just five years?
I bet most investors would say no. Yet many build DCF models that forecast only five years, failing to capture the excess returns Microsoft will generate beyond that period.

Investments and Growth
Another mistake investors make is failing to link investment and growth in their models. Capital expenditures, acquisitions, and R&D are essential for growing revenue and earnings. Every dollar reinvested comes with a certain return on investment, and ignoring this relationship leads to flawed valuations.
According to Mauboussin, DCF models often underestimate the investment required to achieve a given growth rate. This happens for two key reasons:
Acquisitive companies and unrealistic growth assumptions
Companies with a history of acquisitions are often assumed to keep growing at a similar rate, yet future acquisitions are ignored in the investment assumptions.
A more realistic approach? Be conservative when projecting growth for highly acquisitive companies unless you’re explicitly modeling future deals.
Failure to link growth and investment explicitly
The more critical mistake, in my opinion, is that many investors don’t explicitly tie growth to reinvestment via return on investment (ROI).
Mauboussin suggests adding an ROI line to the model to directly link investment and growth.
Including ROIC or ROIIC not only ensures a proper link between investment and growth, but it also helps define the forecast period.
Two birds, one stone.
Double Counting
While the above two mistakes are unmistakably the most severe (and I’ll expand on them below with the Costco example), another common issue in DCF models is double counting—where certain items are factored in more than once, leading to inflated valuations.
Mauboussin highlights share repurchases. Investors sometimes build buybacks into models by assuming a shrinking share count over time, which, naturally, boosts per-share value. The problem, however, is that buybacks are funded with free cash flow—the same cash flow used to value the business in the first place.
By first modeling cash flows and then using those same cash flows to reduce shares outstanding, we’re double counting. The solution in this case is simple: don’t adjust the share count.
Scenarios
Mauboussin points out that most analyst reports rely on a single DCF scenario—which simply isn’t enough.
“Given investing is inherently probabilistic, one scenario—often backed by shaky assumptions—does not constitute thorough analysis. An intelligent investor needs to consider multiple scenarios.”
Sensitivity analysis alone doesn’t cut it. Scenario analysis goes deeper, accounting for the changes in sales, costs, and investments and how they might impact key value drivers.

Take Amazon, for example. A well-structured model might include:
A bullish scenario where AWS thrives, driving strong sales growth and expanding margins.
A bearish scenario where AWS performs poorly, weighing on revenue and profitability.
Investing is about assessing probabilities, not just plugging in a single set of assumptions. The best investors consider multiple outcomes and weigh their likelihoods to make informed decisions.
DCF Model For Costco
Let’s put Mauboussin’s solutions to the test by building a DCF model for Costco.
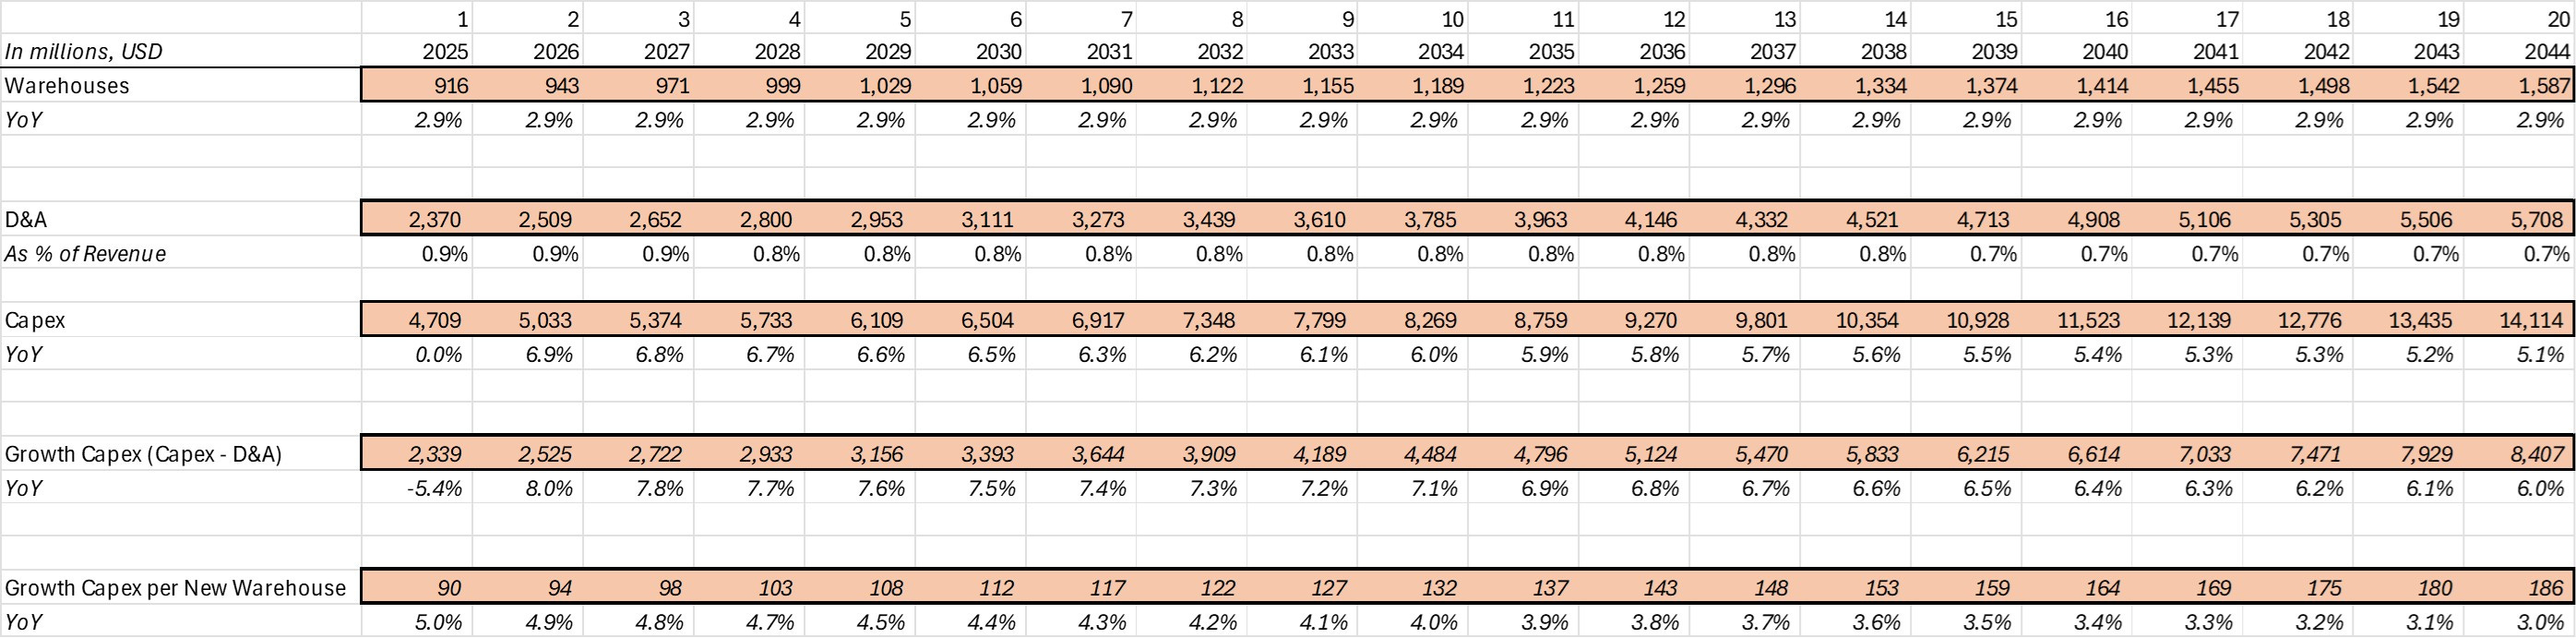
The first thing we need is relevant historical data for Costco, particularly revenue, warehouse count, and revenue per warehouse.
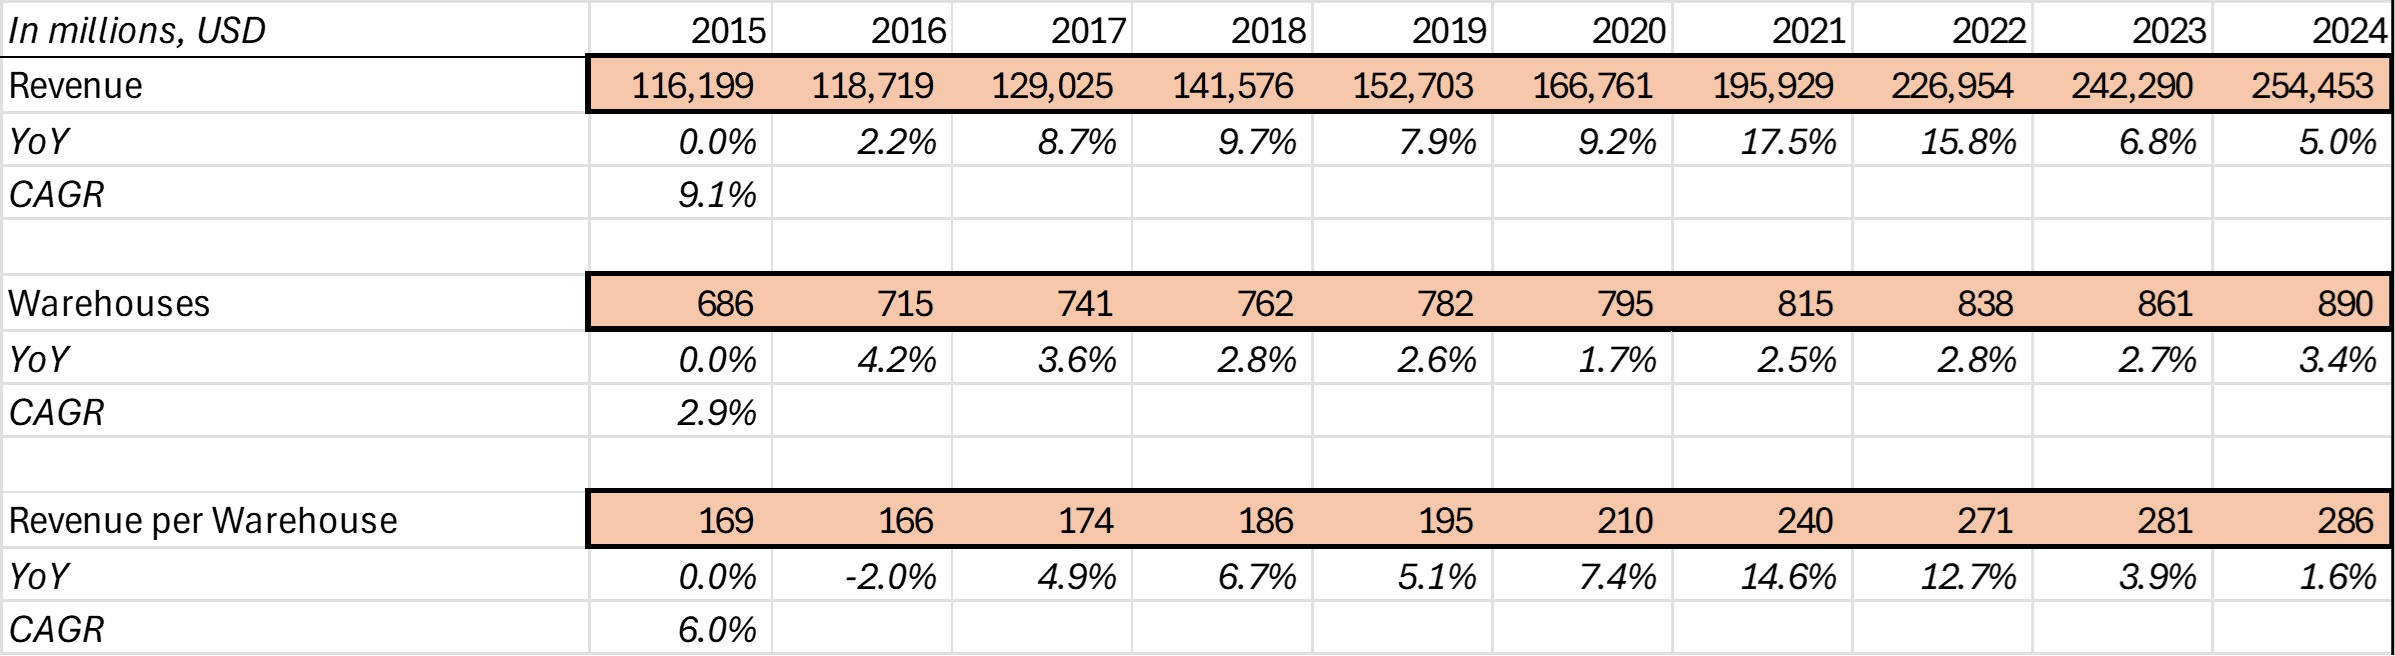
This is important because Costco’s revenue can be projected using unit economics. Assuming warehouse growth continues at around 3% annually (with a more conservative approach, you could go lower), and revenue per warehouse grows at approximately 6%, we’d have a solid revenue projection.
But here comes the first challenge: growth costs money. Rather than simply applying an average capex rate, we need to estimate the cost of building a single warehouse. In 2024, the cost of building a new warehouse was around $85 million, which has been growing at a compounded rate of 5%.
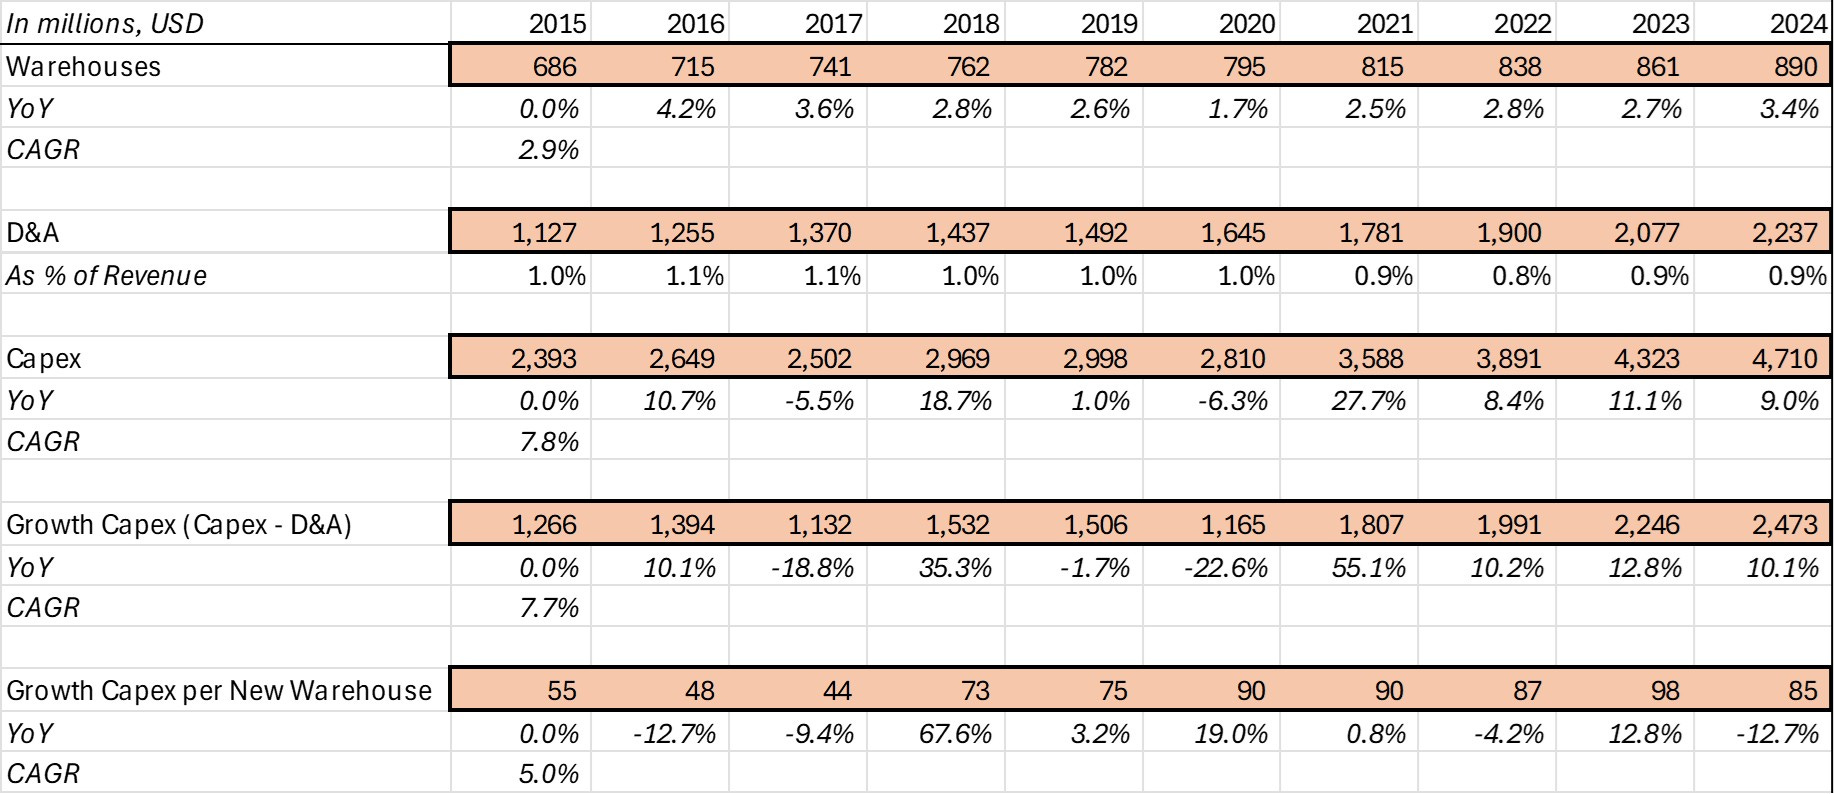
I subtracted D&A from total capex and divided this number by the number of warehouses added to get an average cost per warehouse. Over the past five years, the cost has remained relatively flat, but we’ll continue to project it using a similar growth rate.
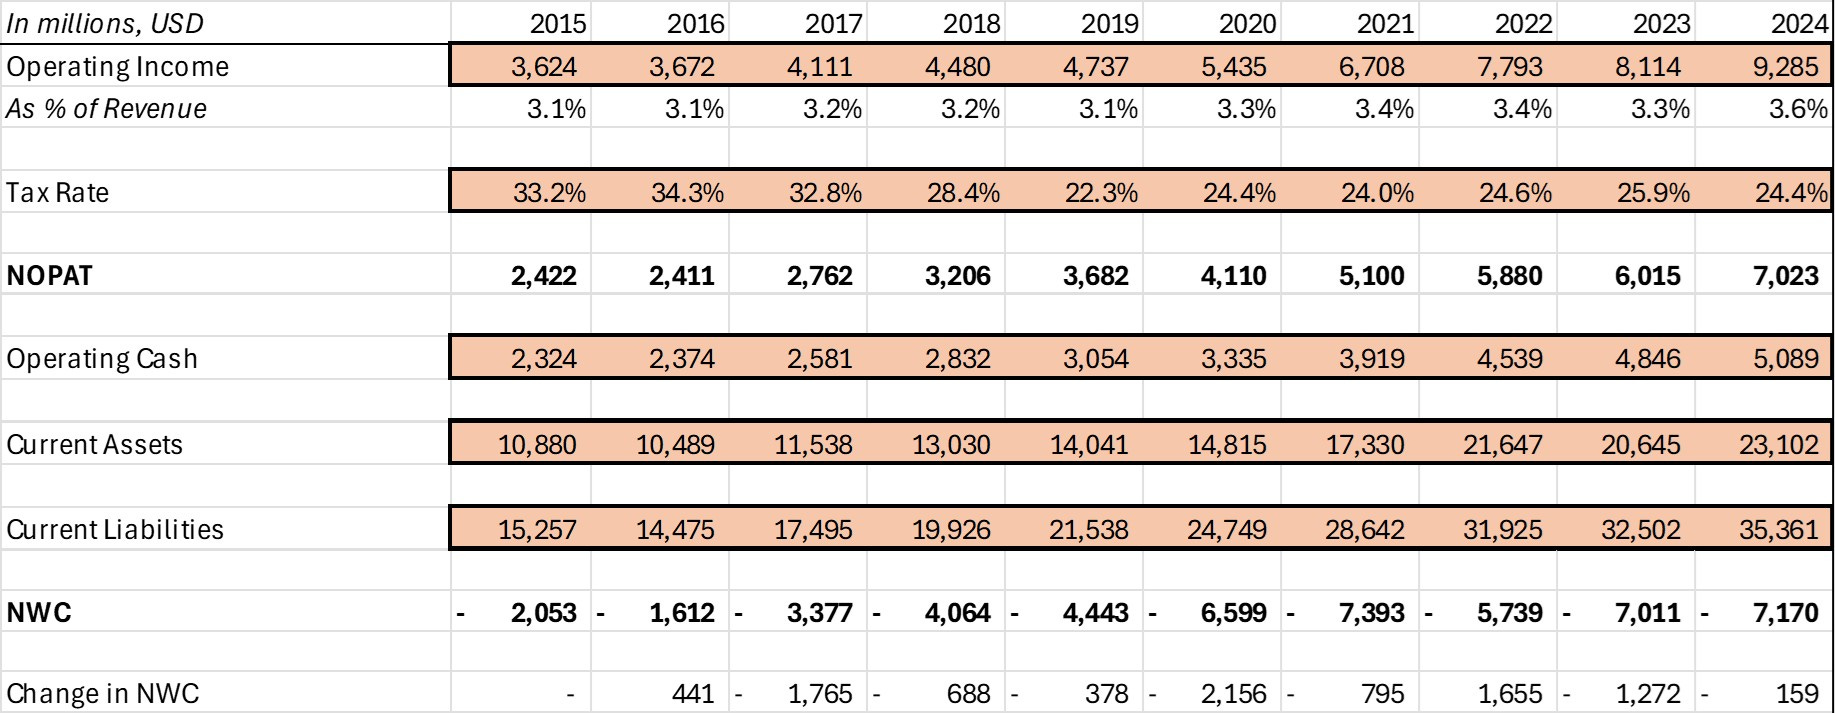
Now to collect data on operating income, tax rates, and net working capital, and we can move forward. Of course, this model is mainly for illustrative purposes, and in a real analysis, you’d support assumptions with both quantitative and qualitative analysis.
We’ll start by projecting the model over the next 20 years, but we’ll make adjustments to ensure the assumptions make sense economically, avoiding the common mistake of an overly short forecast period.
Projecting Costco’s revenue is the first step. Revenue per warehouse has been somewhat volatile, especially in the 2021 and 2022, with inflation driving significant growth. Excluding those years, revenue per warehouse has grown at around 4% year-over-year.
We’ll conservatively project 4% growth, slowing down to 3% by year 10, and further to 2% by year 20. For warehouse count, we’ll assume continued growth of 2.9% annually.
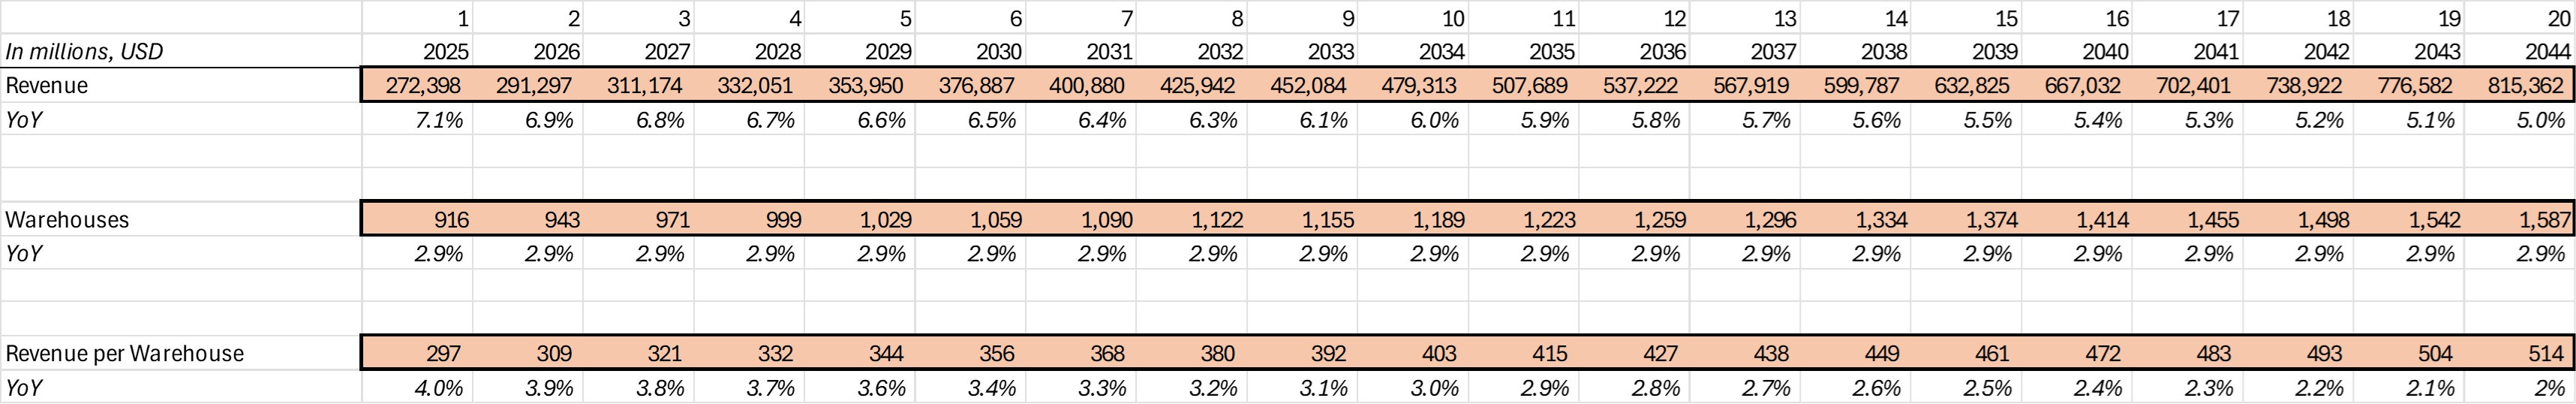
Thus, we project Costco’s revenue to grow at an average rate of 5-7% over the next few years—this seems reasonable and conservative.
For capital expenditures and D&A, we can rely on the stability of D&A as a percentage of revenue, which has been consistently around 0.8% to 1.1%. To be conservative, we’ll assume it decreases slowly to 0.7% by year 20.
For capex related to new warehouses, we’ll assume an annual growth rate of 3-5%, starting at 5% and gradually slowing down. With these assumptions, we now have a projection for D&A and capex that actually makes economic sense.
We’re just missing operating income and net working capital. Costco’s most recent operating margin was 3.6%, and expanding this margin will be difficult due to the nature of the business. Still, I’ll assume gradual expansion towards 4.2% by year 20. Net working capital is trickier, but a reasonable assumption is to keep the growth rate of current assets and liabilities equal to or slightly below the revenue growth rate.
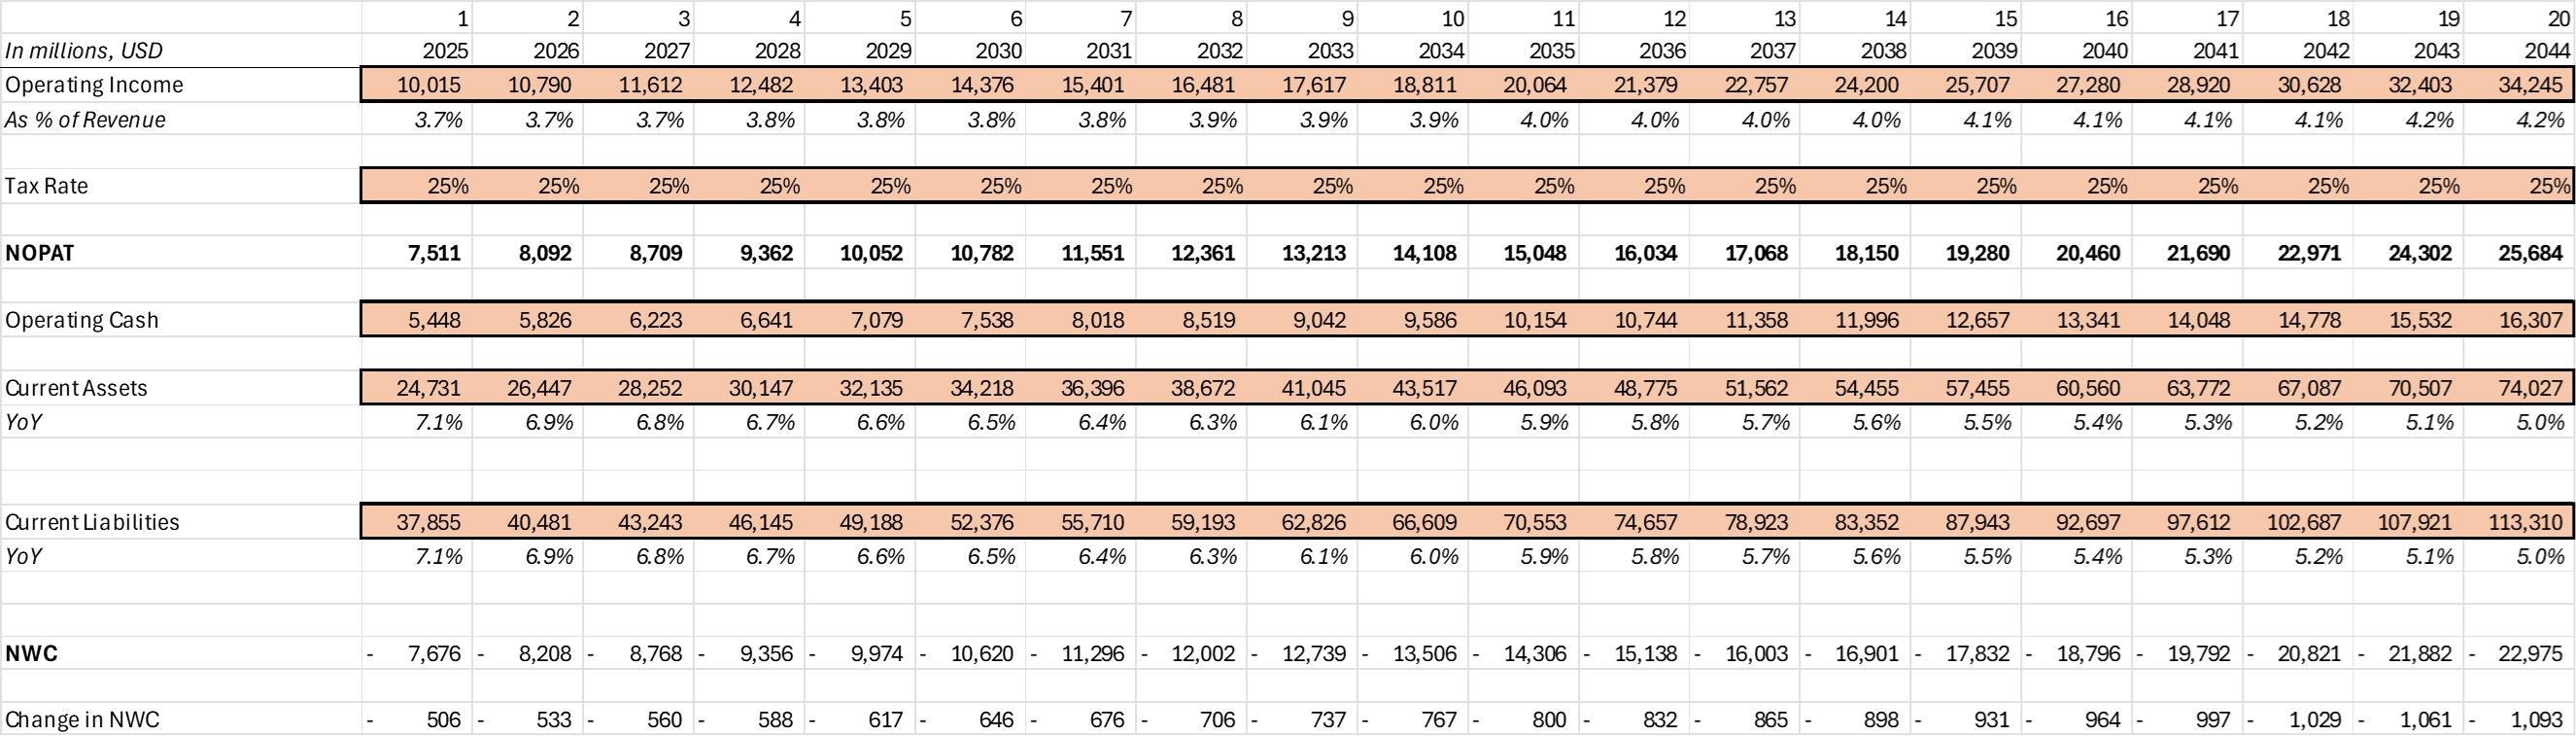
We can now calculate ROIIC, which will help determine when new investments no longer generate value. By taking Costco’s invested capital from 2024, we can project it forward by adding capex, subtracting D&A, and accounting for changes in NWC.
Instead of using ROIC, I opt for ROIIC because it focuses on the return of new investments, while ROIC includes both old and new investments.
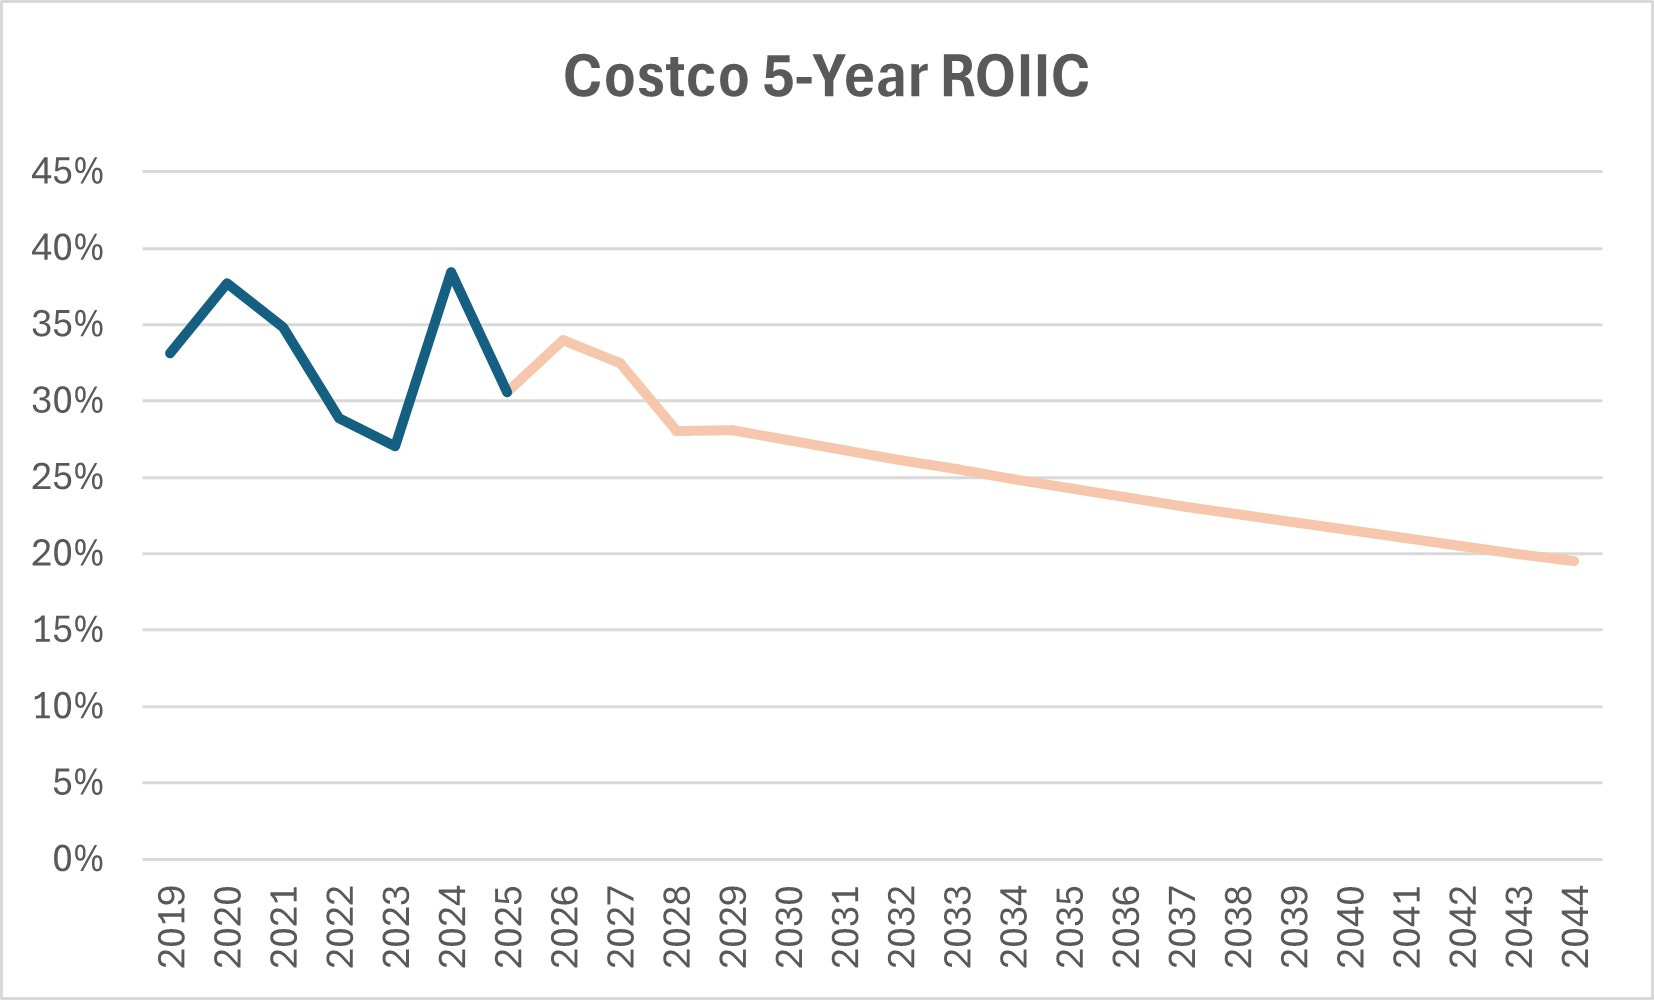
In our model, ROIIC declines over time, which is a good sign (economically speaking), but even by year 20, Costco’s ROIIC remains relatively high.
At this point, we have two options:
We could adjust figures like capex and operating margin to ensure that ROIIC converges with the cost of capital by year 20.
Alternatively, we could extend the forecast period while keeping the same assumptions.
Given Costco’s wide moat and its position in a relatively stable industry, its competitive advantage period is long, so the second option seems more appropriate, but we can first test option one.
While I believe my assumptions are already conservative, I can see how capex per warehouse could grow slightly faster than first projected. Instead of 3% growth by year 20, I’ll change this to 4%. Additionally, I’ll lower the operating margin from 4.2% to 4% by year 20.
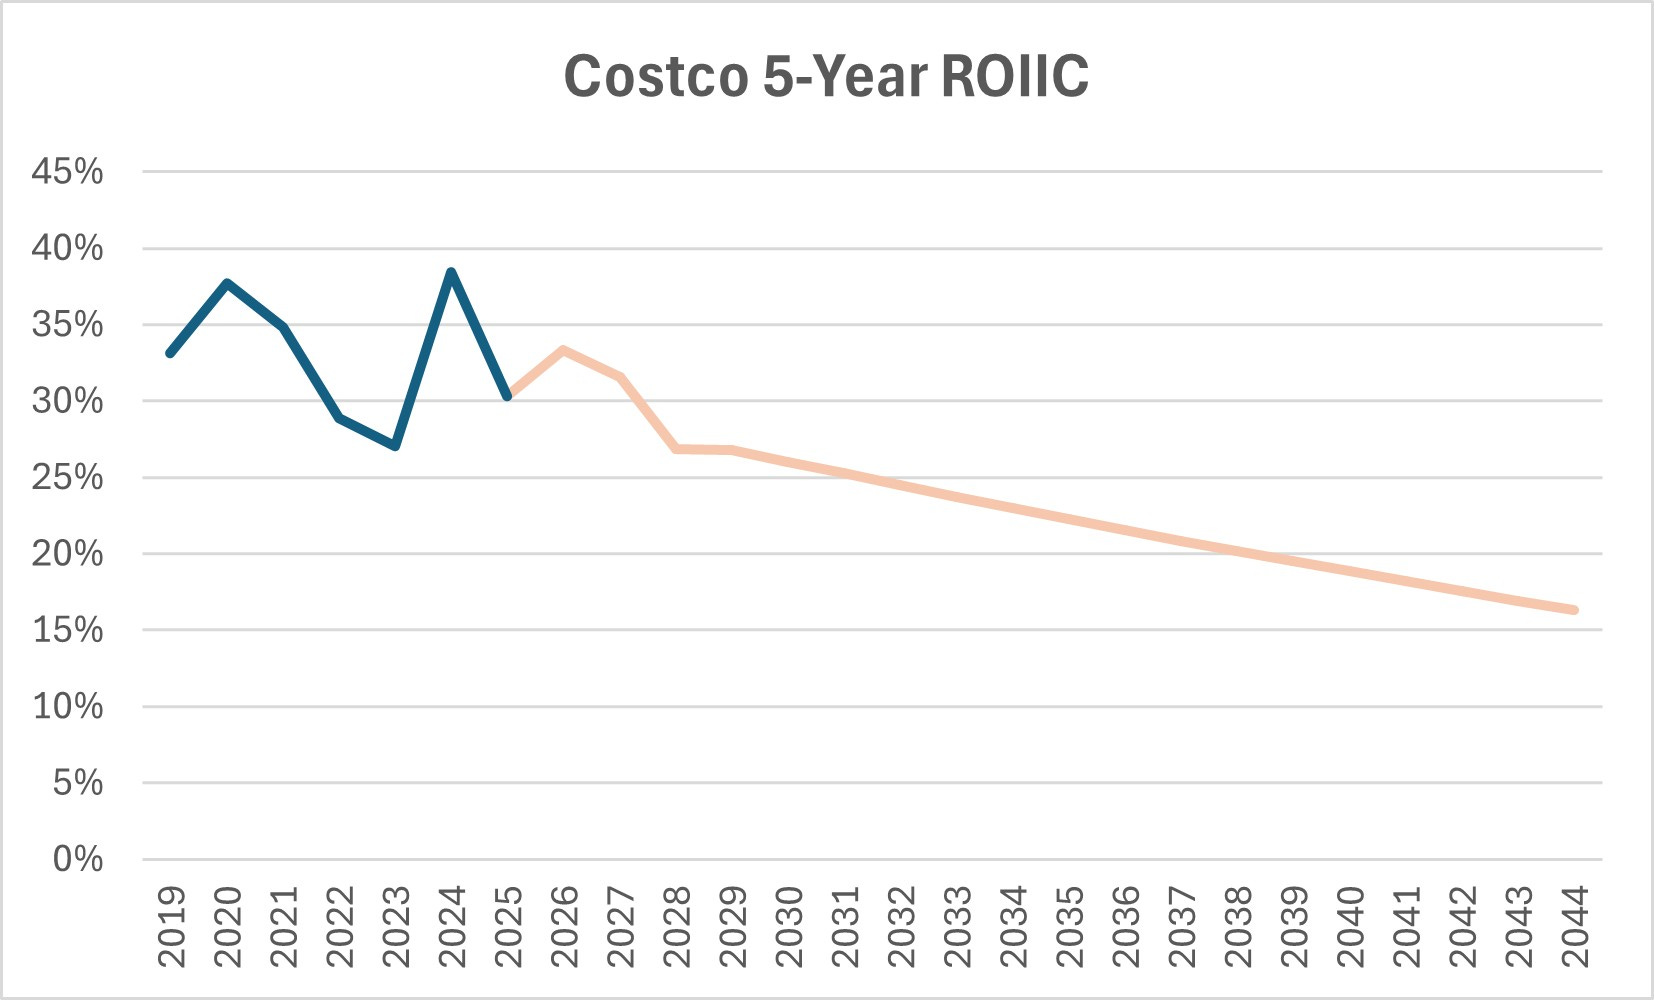
With these changes, ROIIC does decline but remains high. We’ll need to extend the forecast period.
A 30-year forecast period seems to work better. By adjusting the operating margin to 4% by year 30, alongside slight tweaks to capex and net working capital (which will grow slightly slower than revenue), we achieve a more economically sound projection.
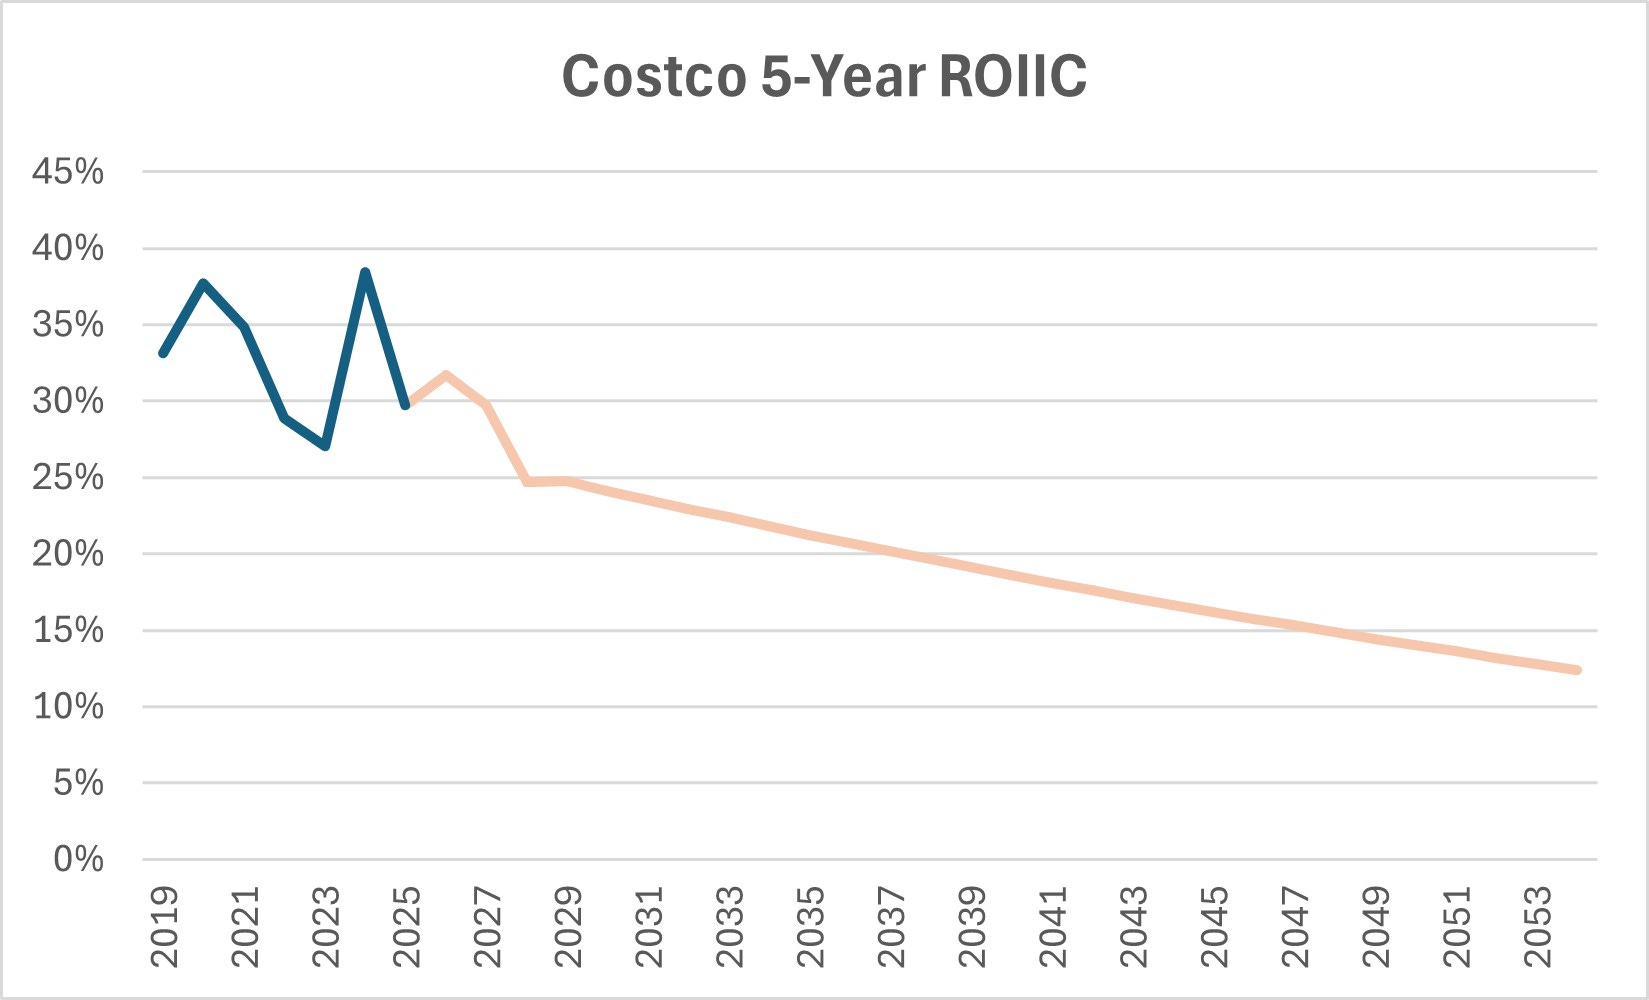
By 2054, ROIIC is projected to be 12%, just above the cost of capital.
I understand projecting 30 years into the future might seem extreme and uncomfortable, but using a terminal value after just five to ten years implicitly assumes cash flows into perpetuity.
So which really is worse? A long explicit forecast where I can actually see what I’m projecting, with the terminal value playing a smaller role? Or a short forecast where the terminal value makes up most of the valuation?
Now all we must do is discount the cash flows. This model suggest Costco is overvalued, but that’s partly because I assumed new investments would generate lower returns right away, which might be too conservative. Valuing Costco wasn’t really the point here, though.
To show how much less weight this model puts on terminal value: the sum of all explicit cash flows is about $418 billion, while the terminal value is $346 billion. In most DCFs, terminal value is at least 80% of the total.
For a company like Costco, with a strong moat in a stable industry, forecasting past 30 years isn’t crazy.
And lastly, this model only looks at one scenario, which Mauboussin warns against. Running multiple scenarios is a must.
Summing up:
Discounted cash flow analysis is the most accurate valuation method. Multiples should be used cautiously, not as the primary approach.
Most DCFs cut the forecast period too short because investors are uncomfortable projecting cash flows far into the future.
A terminal value is just another way of assuming future cash flows—in that sense, it’s no different from projecting them explicitly.
The forecast period should be economically sound, factoring in reversion to the mean.
Growth and investments should be logically connected.
Avoid double counting, and always consider multiple scenarios.
Check out Michael Mauboussin’s articles here (this specific article can be found within the 2005-2011 assembly on page 206):
In case you missed it:


Disclaimer: the information provided is for informational purposes only and should not be considered as financial advice. I am not a financial advisor, and nothing on this platform should be construed as personalized financial advice. All investment decisions should be made based on your own research.
This is a beautifully written and thoughtful post, I am very happy I found it on Christmas Day lol. I am a first-year undergraduate student, and if you ever come out with a valuation course, I would gladly pay 1000 CAD. Otherwise, I ordered expectations investing and wanted to ask what courses you recommend for some active practice/learning? Also, learning Excel? I wanted to give some pushback on the terminal value here though. What is your opinion of the way Constellation Software does valuation? They do scenario analysis (walking wounded, etc.), and I believe they are thoughtful in analyzing whether incremental investment is hitting their IRRs. Still, if you use 20% hurdle rates and can forecast a couple of years reliably (which can be done when a software company has low churn), then the terminal value is not a big factor either, so discounted PV works. What am I missing here? Why not just use a higher hurdle rate? I would LOVE your thoughts here. You are so COOL, THANK YOU SO MUCH
This was absolutely full of insight, thank you so much.
Keep up the great work my friend!