Understanding Return on Invested Capital (ROIC) Part Two
Learn more about ROIC, from free cash flow and intangible investments to incremental ROIC (ROIIC)
Dear reader,
Welcome to this edition of Investing Topics.
A few months ago, I published Understanding Return on Invested Capital (ROIC), where I explained what ROIC is, how it compares to cost of capital, and how to calculate and interpret ROIC.
I concluded, however, that there’s still much to explore—so here we are. Once again, this post draws inspiration from Michael Mauboussin and Dan Callahan’s Counterpoint Global Insights: Return on Invested Capital.
What You’ll Read Today
ROICs Connection With Free Cash Flow
Intangible Investments
Incremental ROIC (ROIIC)
Conclusion
ROICs Connection With Free Cash Flow
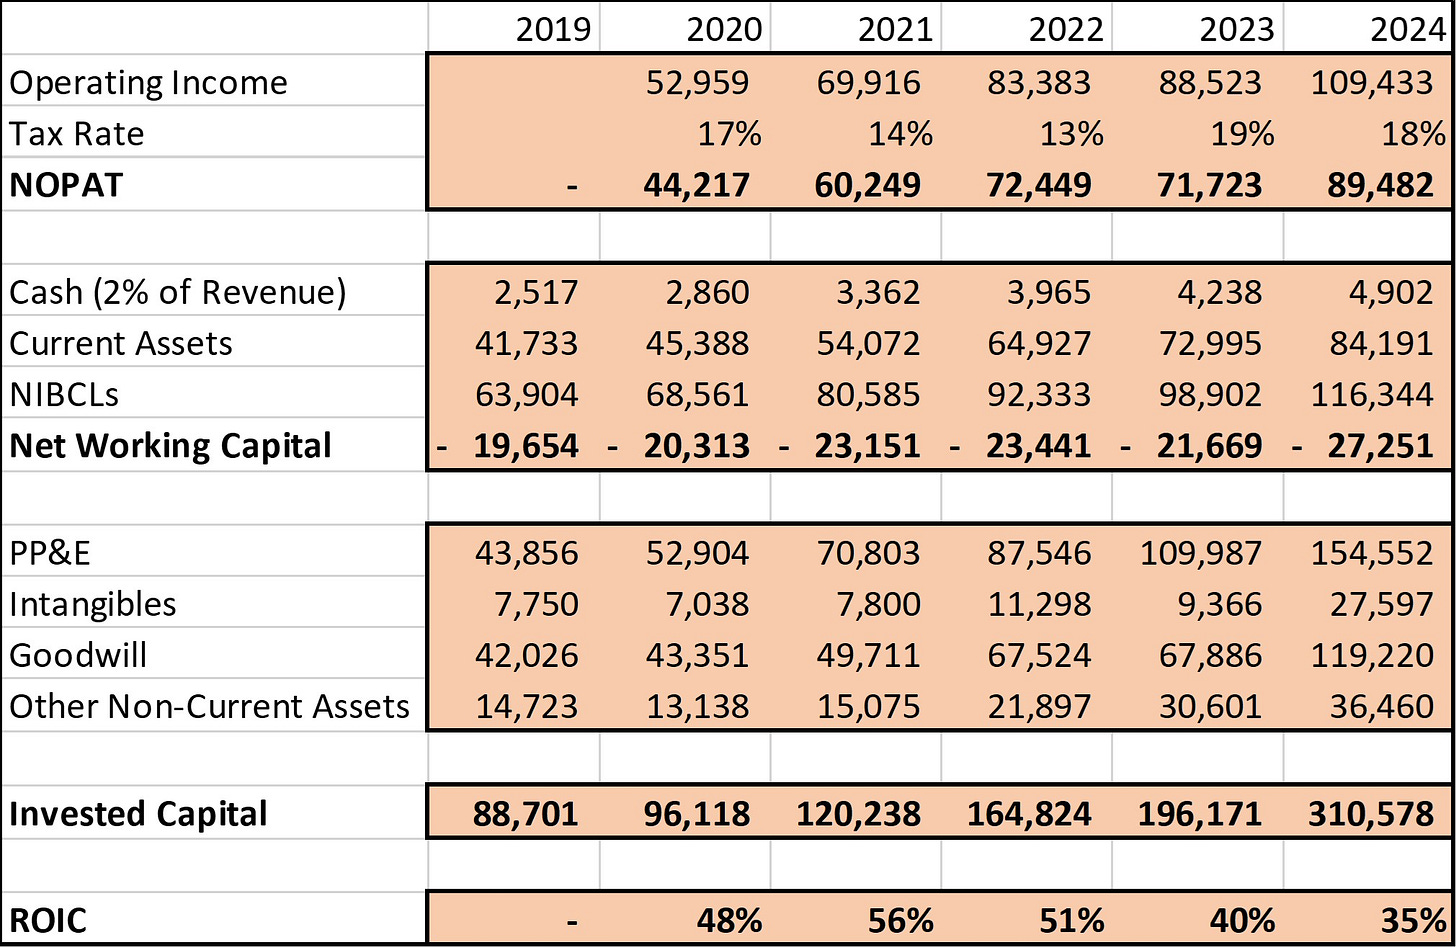
Before diving in, let’s quickly recap. ROIC is one of the most widely used metrics for measuring how efficiently a company uses its capital to generate profits. It is calculated by dividing after-tax operating income (NOPAT) by invested capital, which includes net working capital and non-current operating assets.
ROIC is critical because a company only creates value when its ROIC exceeds its cost of capital, or opportunity cost.
ROIC is also useful when projecting future free cash flows to value a stock. Recall the formula for calculating free cash flow:
Free cash flow starts with NOPAT, adding depreciation and amortization (D&A) while subtracting investments.
When projecting future free cash flows, you can estimate ROIC for any future year by dividing the NOPAT by its corresponding invested capital. Future invested capital can be calculated by taking the initial invested capital (a known value), subtracting D&A, and adding investments.
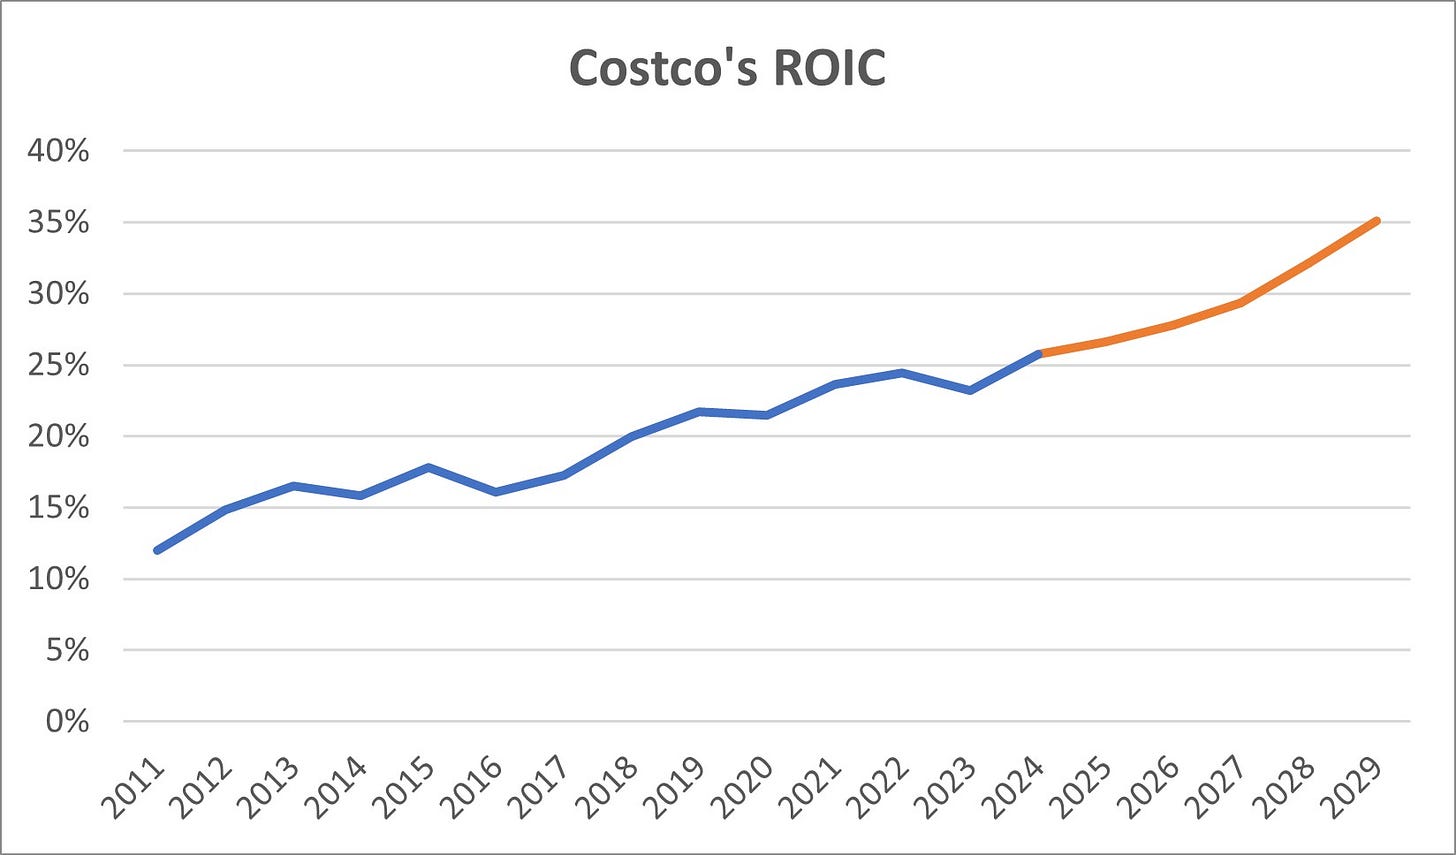
Let’s break this down with an example. Below is a chart of Costco’s ROIC over time, showing an upward trend.
When forecasting Costo’s free cash flows, we would expect its ROIC to either continue rising or remain relatively high. It is, however, important to consider regression toward the mean, which suggests that above-average ROICs (like Costco’s) tend to revert to the average over time.
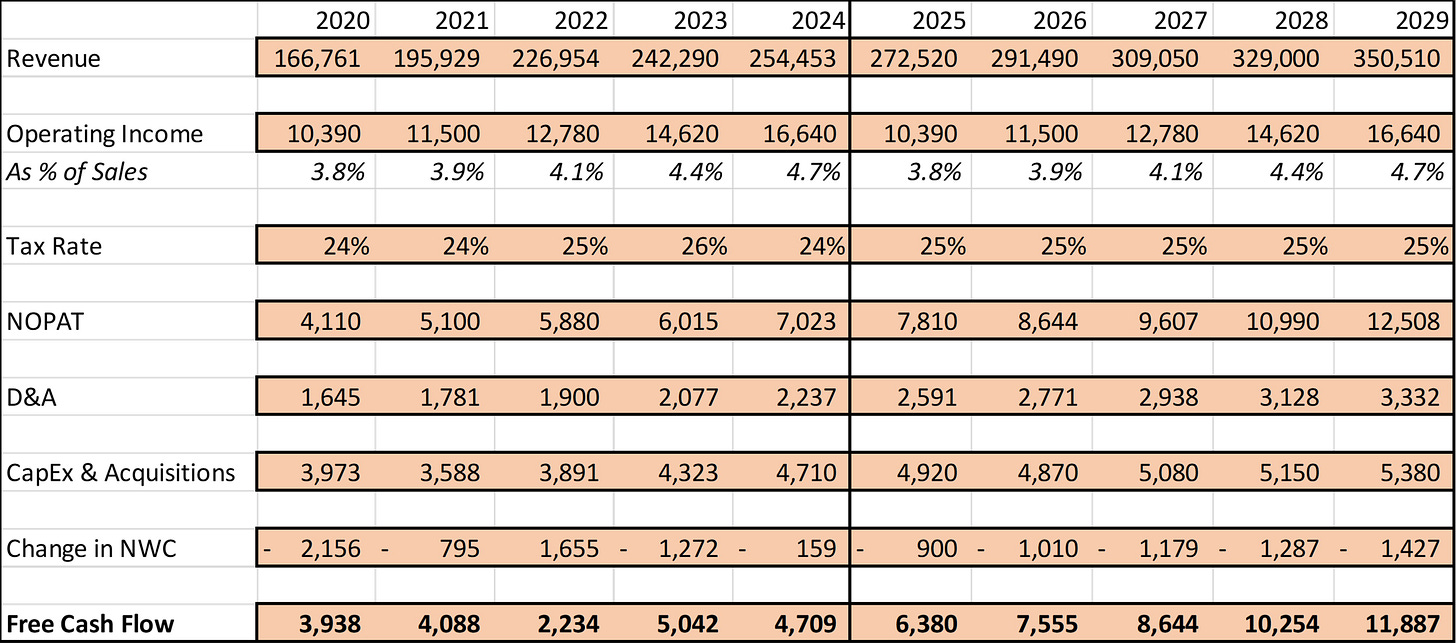
Before continuing, we must forecast Costco’s cash flows. Note that these estimates are not the result of thorough research but are based on analyst projections.
Assume these are the forecasts we use for Costco. Using them and Costco’s invested capital in the base year (2024), we can estimate ROIC for future years.
In 2024, Costco’s invested capital is $28.4 billion, largely made up of property, plant, and equipment (PP&E) valued at $31.6 billion (higher than invested capital due to negative working capital). For 2025, we’ve projected $2.6 billion in D&A and $4.9 billion in capital expenditures. This gives a 2025 PP&E of:
We assume net working capital will decline further, from -$7.2 billion in 2024 to -$8.1 billion in 2025, and that other non-current assets will increase from $3.9 billion to $4.4 billion—both consistent with historical trends.
As a result, our 2025 invested capital becomes:
The ROIC for 2025 is calculated by dividing the 2025 NOPAT by the average invested capital for 2024 and 2025:
By repeating this process for all forecasted years, you can estimate future ROIC trends based on your assumptions.
Our free cash flow forecast assumes Costco will continue improving its ROIC. This is helpful, as it allows us to question the realism of these projections by examining the company’s competitive strengths. If you believe Costco will maintain or widen its moat, these assumptions could be valid. But if you prefer a more conservative approach, you might adjust the forecast to reflect a slower ROIC growth rate or even a decline.
As Mauboussin and Callahan point out:
“This creates a convenient opportunity to build a check in a discounted cash flow (DCF) model.”
Intangible Investments
I chose Costco as an example because its business model relies heavily on physical, tangible assets. But what happens when a company primarily invests in intangible assets?
With the rise of technology, many companies have shifted from being asset-heavy to asset-light, relying on intangible assets. While Costco’s assets are tangible, a company like Microsoft operates differently. Microsoft reinvests not only in PP&E but also in research and development (R&D).
Here’s the issue: intangible investments like R&D are treated as expenses under traditional accounting rules, rather than being capitalized as long-term assets. This accounting treatment ignores the fact that R&D often provides benefits well into the future.
The result?
Asset-light companies can appear to have higher ROICs than they actually do. To tackle this, we can make adjustments by capitalizing these “expenses” ourselves.
The following table shows Microsoft’s ROIC over the past five fiscal years.
The company consistently proves it’s a high-quality company based on ROIC. It dropped, however, in 2023 and 2024, ironically due to substantial tangible investments in PP&E, but also due to a large increase in intangibles and goodwill, likely a result of the acquisition of Activision Blizzard.
But is this ROIC a fair reflection? Does it capture all of the company’s investments?
The answer is no. Microsoft allocates a lot of capital to R&D, sales and marketing (S&M), and general and administrative (G&A) expenses. Mauboussin and Callahan argue that 100% of R&D should be treated as intangible investments, 70% of S&M, and 20% of G&A.
In 2024, Microsoft reported the following operating expenses:
$29.5 billion in R&D
$24.5 billion in S&M
$7.6 billion in G&A
Using the above estimates, Microsoft’s intangible investments in 2024 were:
$29.5 billion (100%) in R&D
$17.1 billion (70%) in S&M
$1.5 billion (20%) in G&A
But adjusting for these investments is not as simple as moving the expenses from the income statement to the balance sheet. Just like tangible assets should be depreciated, intangible assets should be amortized over their useful life.
Research cited by Mauboussin and Callahan estimates useful lives of six years for R&D, and two years for both S&M and G&A.
First we must consider the impact on NOPAT. Then, we’ll look at how this affects invested capital and, ultimately, ROIC.
To start, we calculate all relevant amortization expenses. This requires looking back six years from 2020, as R&D investments from 2014 still contribute to amortization in 2020.
Take a look at the chart below, which shows the amortization expenses for R&D each year. These are calculated by dividing the R&D investments of each year by six, reflecting a six-year useful life. For instance, Microsoft’s $11.4 billion R&D investment in 2014 is amortized at $1.9 billion annually over the subsequent six years. Summing these figures gives the total R&D amortization for any given year. We’ll only look at the period from 2020 to 2024, as those are the years for which we’re calculating ROIC.
Next, repeat the process for S&M and G&A, but with a two-year useful life. Once all amortization amounts are calculated, adjusting NOPAT is simple: add back intangible investments and subtract amortization expenses.
As shown, NOPAT increases—as is typical when accounting for intangible investments. In other words, under GAAP accounting, asset-light companies often appear less profitable than they actually are.
Next, let’s consider the impact on invested capital. To calculate adjusted invested capital, we add all relevant intangible investments from the past and subtract all corresponding amortizations. There’s no need to go back more than six years, as investments made earlier would already be fully amortized.
This adjustment causes invested capital to increase significantly. This makes sense—by capitalizing intangible “expenses”, we’re shifting costs from the income statement to the asset side of the balance sheet.
We can now calculate Microsoft’s adjusted ROIC. The result is much lower than traditional ROIC.
While still high, the adjusted ROIC presents a more grounded and, importantly, more realistic picture.
These adjustments reveal two insights about asset-light companies:
They often appear more expensive than they really are, due to lower reported earnings and thus higher multiples.
Their ROICs, after adjustments, are much closer to average levels, providing a more truthful view of their profitability.
Incremental ROIC (ROIIC)
Mauboussin and Callahan also highlight the importance of incremental ROIC (ROIIC). While absolute ROIC is valuable, they argue stock picking is ultimately about the future. Therefore, investors need a measure that captures incremental change.
ROIIC answers the following question: Assuming existing invested capital and NOPAT remain the same, what return does newly added investment generate?
ROIIC is calculated as:
This measures the rate of the change in NOPAT over one year relative to the investments made in the previous year.
For example, Microsoft’s (adjusted) ROIIC for 2024 is:
This figure is higher than the company’s absolute adjusted ROIC, showing that Microsoft’s recent investments are yielding better returns. However, calculating annual ROIIC can be noisy, as NOPAT might fluctuate, and some investments—like acquisitions—take time to deliver returns (if at all).
Fortunately, there’s a solution. Mauboussin and Callahan recommend using rolling three- or five-year ROIIC periods, to smooth out volatility. The rolling three-year ROIIC formula is:
Note that invested capital should always lag by one year.
ROIIC is a powerful metric because if a company consistently generates ROIIC above its absolute ROIC, it gradually pulls overall ROIC higher.
Conclusion
Understanding ROIC and its nuances—its connection to free cash flow, the treatment of intangible investments, and the role of ROIIC—is essential for evaluating a company’s performance and future potential.
Again, if you found this article valuable and want to learn more, I highly recommend reading Mauboussin’s and Callahan’s article:
In case you missed it:
Disclaimer: the information provided is for informational purposes only and should not be considered as financial advice. I am not a financial advisor, and nothing on this platform should be construed as personalized financial advice. All investment decisions should be made based on your own research.


