


What's Priced In? The Question Every Investor Must Ask
Understand market expectations and profit when it gets it wrong

You’re reading a free post.
Premium members get:
One high-conviction stock thesis each month (first thesis is already here)
Monthly Portfolio Letters
Stock updates & in-depth valuations
Exclusive access to our research platform Summit’s Analytics (launching next week)
Get 30% off now: only €105/year (€8.75/month)
A stock price reflects a set of expectations about future cash flows. Our job is to find out when those expectations are misaligned with a company’s likely outcomes.
Michael Mauboussin calls this “Expectations Investing”: comparing what the market expects to what a company can realistically deliver.
When expectations are too high, we walk away. When they’re too low, we buy.
Today, I’ll show you how to spot these mismatches, walk through real examples, and give you a mental model you can use immediately.
Expectations vs. Fundamentals
A stock price reflects the market’s view of a company’s long-term cash flows. It’s not about next quarter’s earnings, but a decade or more of performance. Investors that focus too much on quarterly earnings beats or misses, risk missing the bigger picture.
Multiples offer a quick snapshot of valuation but obscure the true drivers of value: growth, returns on capital, and reinvestment. They compress complex assumptions into a single number.
Underneath every price is a set of expectations. The challenge is figuring out what those expectations are.
That’s where the reverse DCF comes in, where we solve for the growth rate instead of the discount rate. This helps figure out what growth rate the stock price implies.
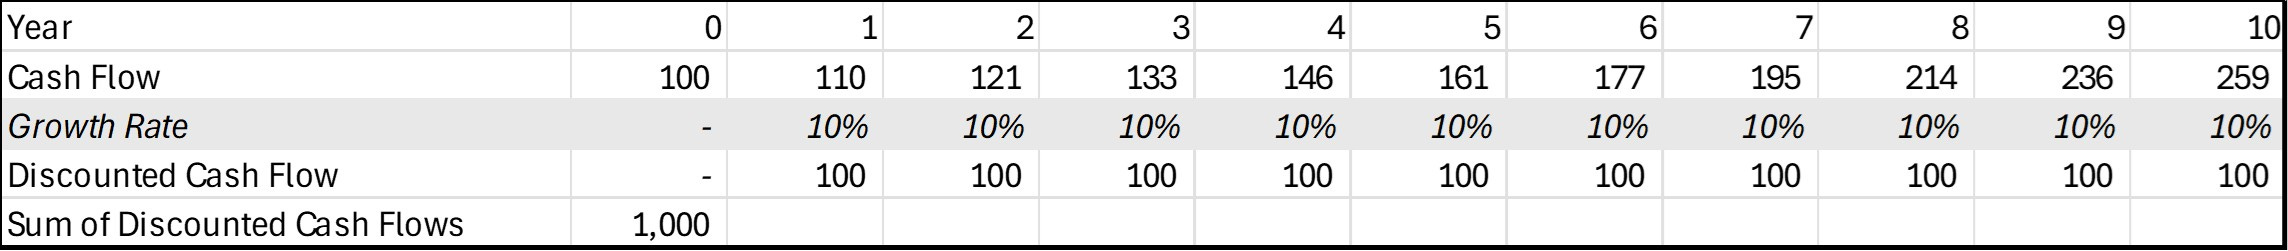
A simplified example:
Our fictional company will generate cash flows for 10 years, after which it ceases to exist. Its cash flow in year 0 is $100.
The company’s current market value is $1,000.
Using a 10% discount rate, we can reverse-engineer: the company must grow its free cash flows by 10% each year to justify the $1,000 valuation.
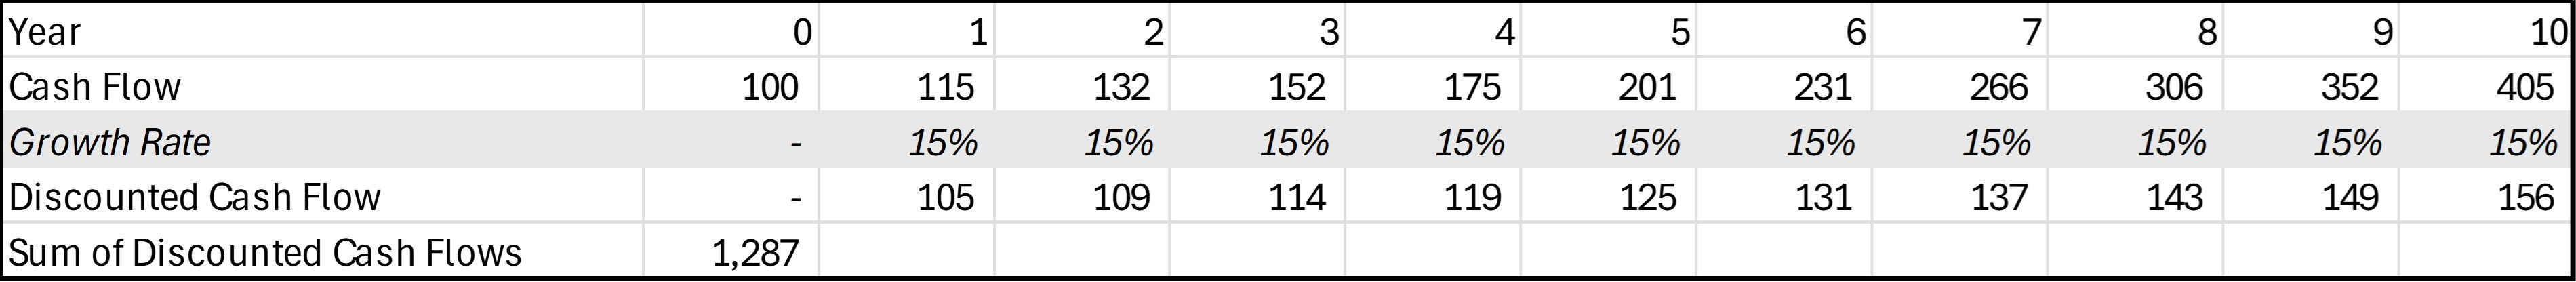
These are the expectations set by the market. But let’s say you believe the company can grow 15% annually instead of 10%. In that case, the market is underpricing the business: the company’s value should be closer to $1,300, not $1,000.
That’s the essence of Expectations Investing.
Real-World Examples
The best opportunities arise when fundamentals and expectations diverge—sometimes even in high-quality, wide-moat businesses.
But they’re rarely obvious. Real opportunities often hide behind noise, uncertainty, and risk. And sometimes, what looks like a mismatch turns out to be a trap. Companies can disappoint, fail, or even go bankrupt.
Meta Platforms is a perfect real-life lesson. In 2022, Meta’s stock dropped over 70%. Expectations collapsed.
There’s no denying fundamentals were shaky. If you recall, Meta poured billions into the Metaverse—a bet far outside its core business—while user growth slowed, pressured by TikTok.
Revenue flattened and operating income declined sharply, driven by surging R&D costs. Free cash flow plummeted, thanks to both lower profits and higher capex. Still, the company generated $50 billion in operating cash flow.
In hindsight, it’s clear that the market’s fear far exceeded the fundamental risks. At its low, Meta’s market cap dropped below $250 billion, implying a 20% operating cash flow yield. Yes, this is classic hindsight bias: the situation at the time was extremely uncertain. But the case of Meta is a valuable lesson nonetheless.
A more recent, still-unfolding case is Novo Nordisk. Expectations have come down, yet fundamentals remain largely intact. Similar disconnects may exist in names like Nike, Estée Lauder, and Adobe.
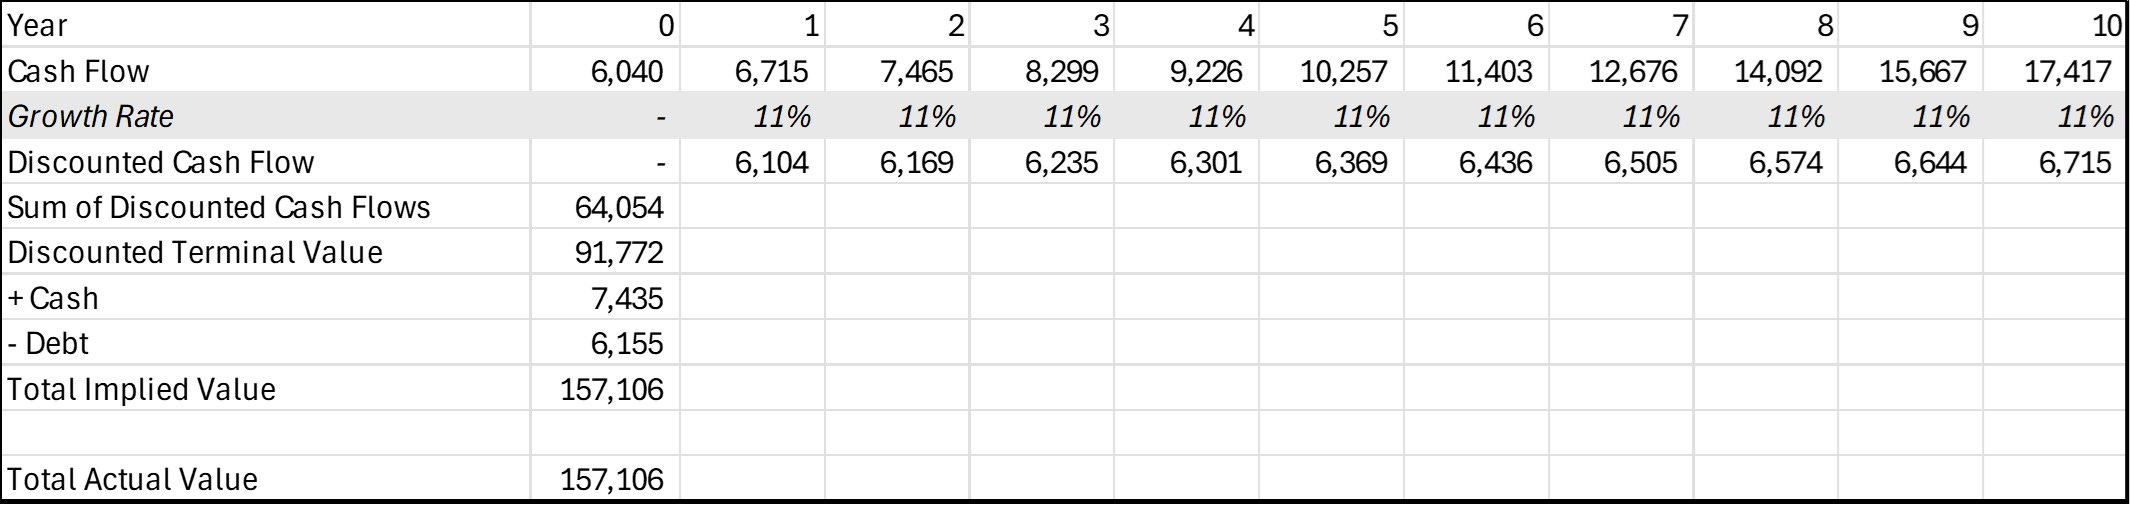
Take Adobe, for example. At today’s valuation, the market is pricing in roughly 11% annual free cash flow growth, which is well below its historical average. This is how Expectations Investing can help you make decisions.
A Simple Mental Model
Finding out what the market expects from a stock isn’t easy.
In theory, you’d define a precise forecast period and model future cash flows based on the three core value drivers: growth, returns on capital, and reinvestment. In practice, this reverse DCF works better as a mental model, a quick sanity check, not a full valuation.
That’s why simplicity is key.
A standard 10-year model typically works well: it captures a period of stable growth without letting the terminal value dominate the valuation.
Once you have an implied growth rate, the key question becomes: is this expectation too optimistic or too pessimistic?
Answering that requires thorough research and an unbiased view. Ideally, the mismatch is obvious: if a stock is priced for no growth, yet you believe it can compound at double digits, that’s a clear opportunity.
They’re rare, but they do happen.
In the end, investing isn’t just about finding fantastic businesses. Even a great company, if priced for perfection, can perform well yet have a stagnant stock. Real investing success lies in spotting when expectations have drifted from fundamentals.
In case you missed it:


Disclaimer: the information provided is for informational purposes only and should not be considered as financial advice. I am not a financial advisor, and nothing on this platform should be construed as personalized financial advice. All investment decisions should be made based on your own research.