
Upgrading Our DCF Models (and the Thinking Behind Them)

A discounted cash flow (DCF) model has a mixed reputation in the investing community.
On one side, you have true believers. They build detailed models, plug in their own assumptions, and work with precise price targets. On the other, skeptics argue that DCFs are always wrong and therefore not worth using at all.
But as Michael Mauboussin puts it:
Whenever you value a stake in a cash-generating business, you are discounting future cash flows. You might make that implicit by using a P/E or P/FCF multiple (or any other multiple), but it is still there. The intrinsic value of a business is, and always will be, the present value of the cash it can return to its owners.
This is why I believe we should always use a (reverse) DCF, no matter how difficult it seems. Because it isn’t about being right. Our assumptions will always differ from what actually happens. The goal is being less wrong than the market.
Because I believe in the DCF framework, I’ve added DCF models to our stock research platform, Summit’s Analytics (we’re soon rebranding, but bear with me).
That said, the current implementation does not yet meet my own standards, and it certainly does not meet Mauboussin’s. Important features are missing, which limits how useful the models really are.
In this post, I’ll walk through what’s lacking, why it matters, and how we plan to fix it. Think of this as both a guide to building better DCFs and a transparent update on where the platform is headed.
The Current State of The DCF
At the moment, the platform offers two DCF models: a standard DCF and reverse DCF.
Let’s start with the regular DCF.
You plug in a set of financial assumptions: revenue growth, margins, capex, and so on. Then you choose a discount rate, a terminal growth rate, and a forecast period.
That’s it.
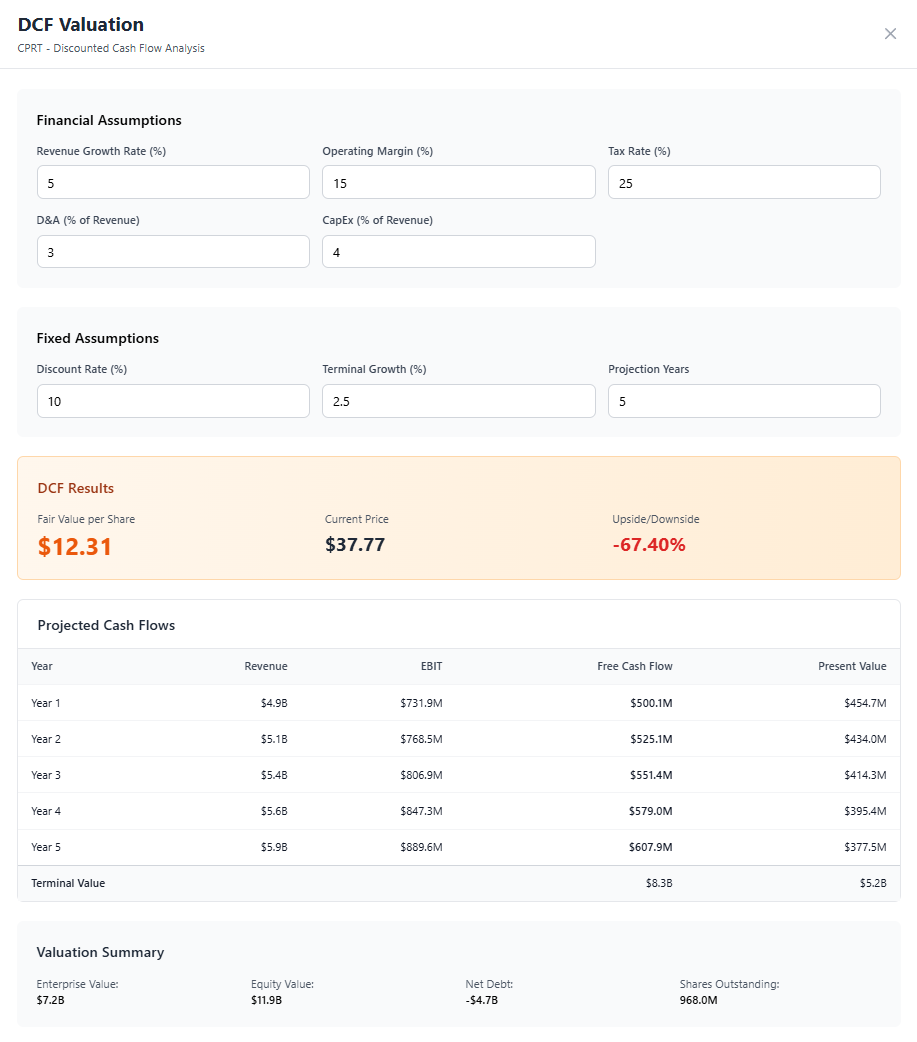
Simplicity is good. But in this case, the model is clearly too simple.
Let’s start with the financial assumptions.
Today, all assumptions are constant across the entire forecast period. If you assume 5% revenue growth, it stays at 5% every single year. The same applies to operating margins, tax rates, D&A, and capex.
This obviously doesn’t reflect reality.
Growth slows, margins mature, and capital intensity changes. Users should be able to reflect this reality by adjusting assumptions over time, not locking themselves into a single number.
Fix 1: Financial assumptions must be dynamic and customizableAlongside my own experience, I’m using an older post of mine where I outlined the most common DCF mistakes. We’ll be tackling all of them here.

Another frequent mistake is how investors treat explicit and implicit value.
Many models use short forecast periods, often five years, under the argument that anything beyond that is too uncertain to forecast. But applying a terminal value after five years doesn’t eliminate uncertainty. It simply makes the rest of the future implicit.
A good DCF should clearly show how much of the intrinsic value comes from the explicit forecast period and how much comes from the terminal value. This is a strong sanity check.
If most of the value comes from the terminal value, the model is doing very little actual work, and you should probably rethink your model.
Fix 2: Show the percentage split between forecast-period value and terminal valueThe length of the explicit forecast period should also make sense economically.
This is the period during which a company earns excess returns on capital. Once competitive advantages fade, returns converge towards the cost of capital and the terminal phase begins.
To make this visible, a DCF needs an explicit return on investment line. This way users avoid the mistake of projecting too much growth against too little investment or vice versa.
Fix 3: Implement an ROI line by linking profits to invested capitalFuture invested capital can be approximated by adding capex and subtracting D&A from the base year invested capital amount. It’s an imperfect proxy, but it works.
This method fails to account for intangible investments, but that’s another story entirely. Those investments mostly flow through the income statement and therefore don’t appear on the balance sheet or in invested capital.
Right now, the model does not connect investment intensity to growth or returns. It should.
Fix 4: Link investment to growth by dynamically adjusting invested capital and ROIC through capex and D&AThese fixes largely address the core economic logic of the model. But we’re not done yet.
Currently, users can see projected revenue, operating income, free cash flow, and their present values. That’s useful, but incomplete.
Users should be able to manually adjust projected figures. For example, companies often provide guidance for the coming year, and the model should make it easy to incorporate that information.
Projections also need more transparency. Growth rates, margins, capex, and D&A should be shown explicitly, and they must be manually adjustable too.
Fix 5: Add more detail to projected figures and make them fully customizableThe Current State of The Reverse DCF
The reverse DCF on Summit’s Analytics is also simple, but unlike the standard DCF, it is already quite useful.
That said, there are still improvements we can and should make.
Right now, users can reverse-engineer the implied free cash flow growth rate embedded in the current stock price. This is helpful, but the model lives in isolation.
What I mean by that is users can reverse-engineer the implied free cash flow growth rate, but that number on its own might not be enough.
If the model tells you the market implies 10% growth, how do you know whether that’s too high, too low, or roughly fair?
To answer that, the model needs context. We should show historical growth rates alongside the implied growth rate, as well as base rates from relevant peer groups, such as companies of similar size or in the same industry.
Context is everything.
Fix 1: Add historical growth rates and base rates to the modelAnd just like in the standard DCF, we’ll also show how much of the intrinsic value comes from the forecast period versus the terminal value.
Fix 2: Show the percentage split between forecast-period value and terminal valueUltimately, both the DCF and reverse DCF model should help you value the stocks you’re interested in.
The DCF helps you answer what you believe in, while the reverse DCF helps you answer what the market believes in. Both are useful in their own right.
My goal with Summit’s Analytics is to give you a structured way to think about stocks, revisit your assumptions over time, and do the work yourself.
Proper, detailed yet simple, valuation models are an important part of that.
If you have any other feedback or if you believe I’m missing any aspects of the model, make sure to let me know.
Thanks for reading.
Lucas
Author & Founder, Summit Stocks
In case you missed it:


Disclaimer: the information provided is for informational purposes only and should not be considered as financial advice. I am not a financial advisor, and nothing on this platform should be construed as personalized financial advice. All investment decisions should be made based on your own research.