How Monte Carlo Simulation Changes Valuation
Monte Carlo simulation gives you a distribution of intrinsic values, and a better way to make investing decisions
In the last post, I argued that fair value should reflect expected value: not a single scenario, but a distribution of possible futures.
This post is about how to model that distribution. Not by building a more complex forecast, but by modeling uncertainty through simulation.

What is Monte Carlo Simulation?
A Monte Carlo simulation is a tool for modeling uncertainty. Instead of predicting one future—or three scenarios like bull, base, and bear—you define a range of possible inputs, and let the model explore thousands of possible paths.
In each run, the simulation draws different values for growth, margins, and reinvestment from the ranges you define. This still means garbage in, garbage out, but you avoid the mistake of false precision.
Some runs assume a company compounding at high rates for 20+ years. Others assume things don’t go as well. Most fall somewhere in between.
The result isn’t a single fair value. It’s a distribution of intrinsic values. A curve, not a point. And no, this isn’t about complexity. It’s about replacing false precision with probabilistic thinking.
And the payoff is practical: you can now evaluate asymmetry. If the stock trades near the bottom of your simulated range, the risk-reward is positive. If it’s priced near the 90th percentile, the odds are against you. That’s a strong basis for conviction and position sizing.
What It Looks Like in Practice
Monte Carlo is theoretically powerful, but practically underused by investors. That’s probably because incorporating it into a DCF model can be tedious. Fortunately, we’re working to make this easy and scalable inside Summit’s Analytics, our stock platform for premium members.
For now, let’s walk through a simplified Monte Carlo example to show how the method works and what it reveals.
We’ll assume:
Starting revenue of $100
A 10% discount rate
A 2.5% terminal growth rate
These are standard. But here’s where Monte Carlo changes things: instead of picking one growth rate and one free cash flow margin, we define ranges:
Revenue growth of 2-8%
Free cash flow margin of 15-25%
Forecast period of 10 to 30 years
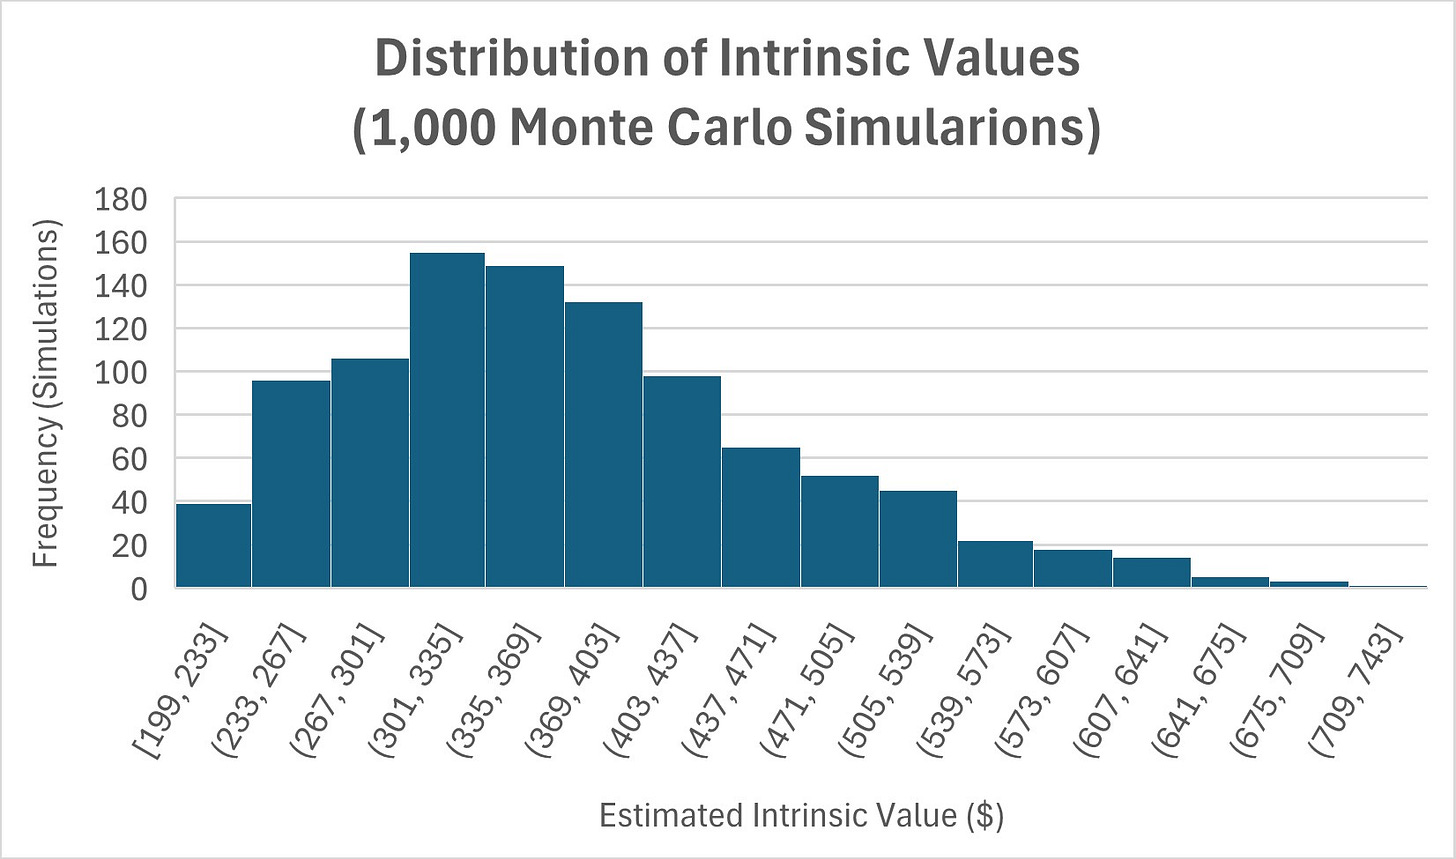
Rather than forcing a single view of the future, we simulate 1,000 different scenarios, each with a random combination of these three variables. The result is a distribution of intrinsic values.
Now imagine the current stock price is $250. This chart immediately becomes actionable: most of the distribution is above $250, meaning the asymmetry is in your favor.
This example produces a right-skewed distribution for two reasons:
Compounding effect: Higher growth and longer forecast periods result in exponentially larger free cash flows and terminal values.
Uncorrelated inputs: In this model, combinations are simulated independently, but in reality, they’re often positively correlated. As a result, high-growth, high-margin scenarios are less common in this simulation, making the right tail look fatter.
While this model is simple, the output is already more useful than a single-point fair value.
How Monte Carlo Makes You a Better Investor
The biggest advantages of modeling distributions is that it forces better decisions. You’re no longer dealing with one fair value, but a curve of possibilities. As a result, you start thinking in ranges, probabilities, and asymmetries.
Yes, you can still use the expected value—the average of all outcomes—as your fair value. But now you can also ask better questions:
What’s the probability of downside from today’s price?
How wide is the distribution?
How much conviction do I have in these assumptions?
This framework helps position sizing too. A narrow, high-mean distribution supports a larger weight. A wide or volatile one should translate into a smaller position.
However, investors should also consider its limitations. Monte Carlo is still just a model. Garbage in, garbage out applies: a simulation won’t fix bad assumptions.
What’s Next
We’re building Monte Carlo simulation directly into Summit’s Analytics, our premium stock research platform.
Right now, we’re focused on perfecting the core product (that is, making it effortless to search for stocks and surface the most important financial data at a glance). Once that foundation is in place, we’ll roll out advanced tools, including Monte Carlo.
You’ll define your assumptions. We’ll run the simulations. And you’ll get clean, intuitive output: full distributions, expected values, downside probabilities, all in one view.
In case you missed it:
Disclaimer: the information provided is for informational purposes only and should not be considered as financial advice. I am not a financial advisor, and nothing on this platform should be construed as personalized financial advice. All investment decisions should be made based on your own research.


Sounds like fun.