
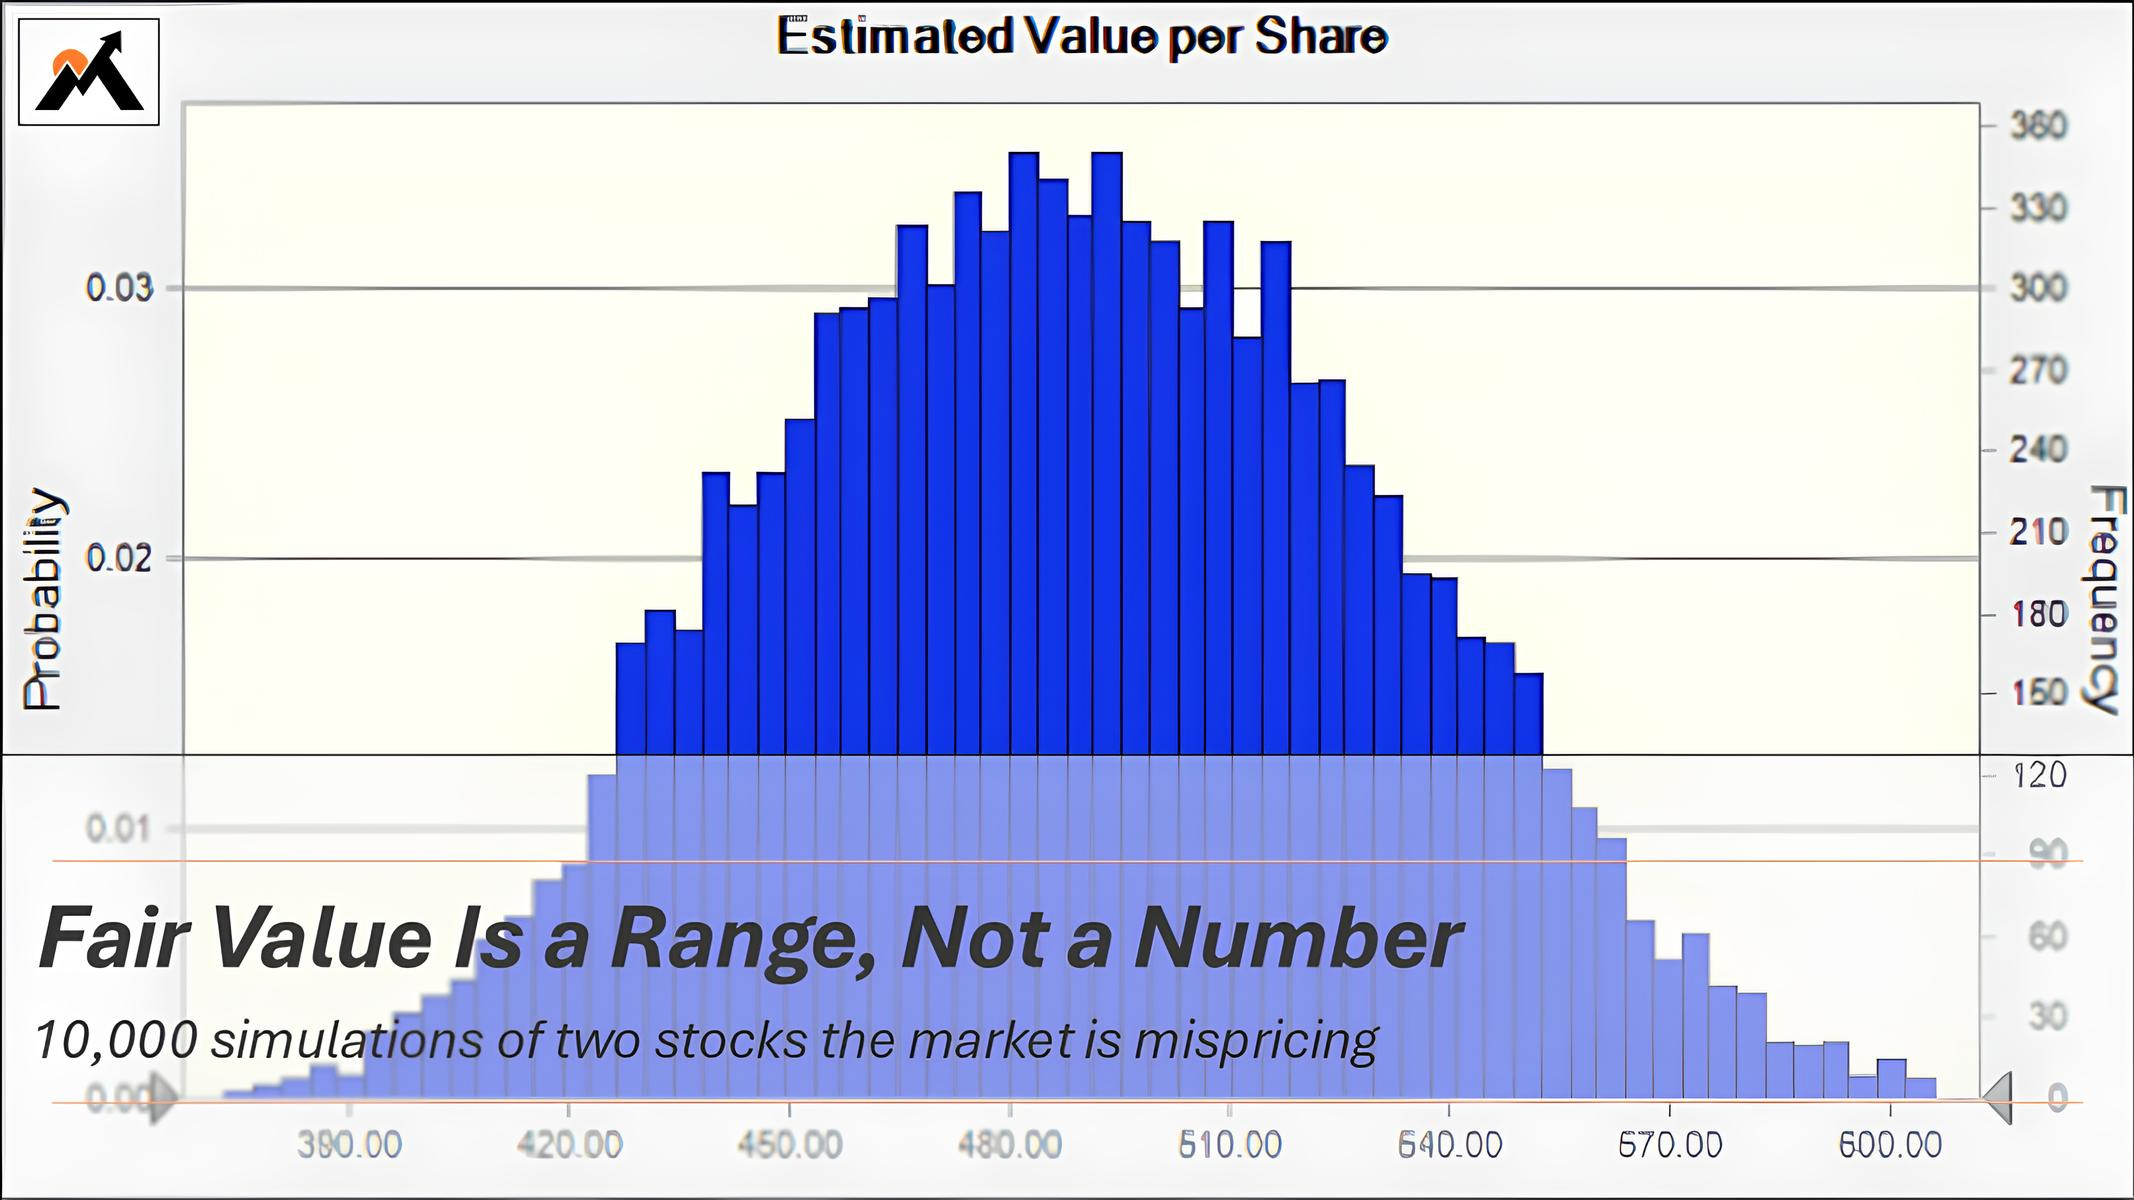
Fair Value Is a Range, Not a Number
10,000 simulations of two stocks the market is mispricing

Valuation isn’t a science where the right inputs guarantee the right answer, nor is it an art driven by talent. As Aswath Damodaran puts it, valuation is a craft. You get better by doing it.
And most people are doing it wrong. Even I’ve been doing it wrong.
Most people anchor to a single number. One fair value. But we live in a world of uncertainty, with different outcomes, different trajectories, and different risks. And that’s where Monte Carlo comes in.
Instead of guessing one future, you simulate thousands. You don’t just get a fair value, but a distribution of outcomes. And that lets you do three things:
Quantify downside and upside risk
Understand how much your assumptions actually matter
Spot asymmetry, where potential reward far outweighs potential losses
Today’s post puts all that into practice. By analyzing two popular stocks, I’ll showcase the strength of Monte Carlo.
Refining the Model
This post builds on last week’s walkthrough of Monte Carlo valuation. If you missed it, I recommend reading (or skimming) that first. It explains how to do probability-based valuation, using a model built on Damodaran’s framework.

The original version used three variables: revenue growth rate, operating margin, and sales-to-capital ratio. Growth was fixed throughout the forecast period, while margin and reinvestment tapered toward a final-year value.
In the new model, I’ve added two improvements:
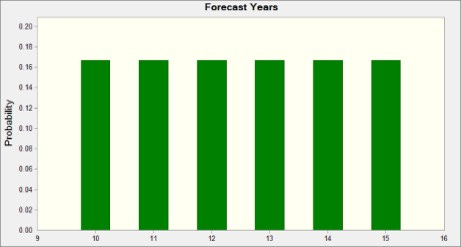
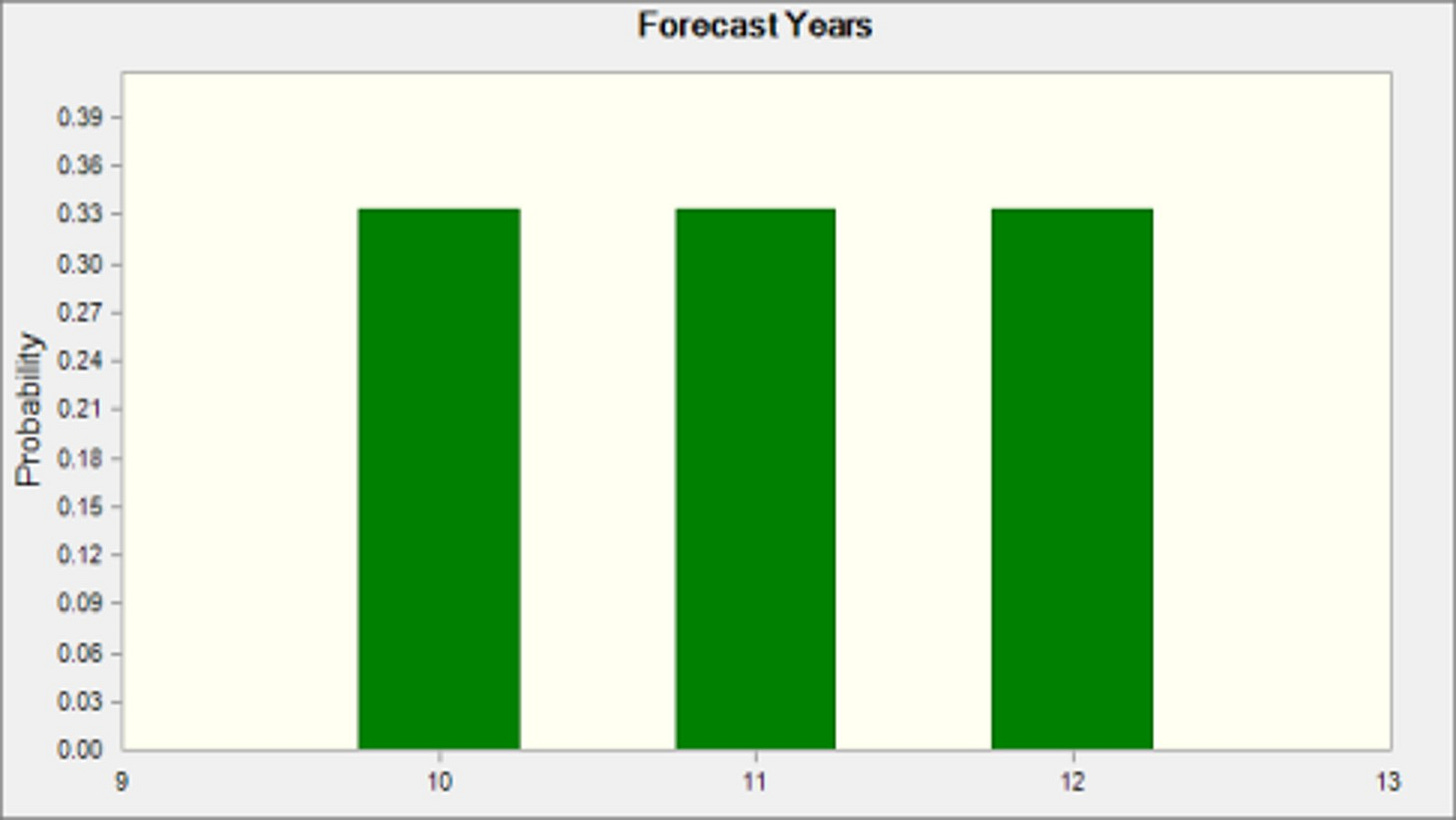
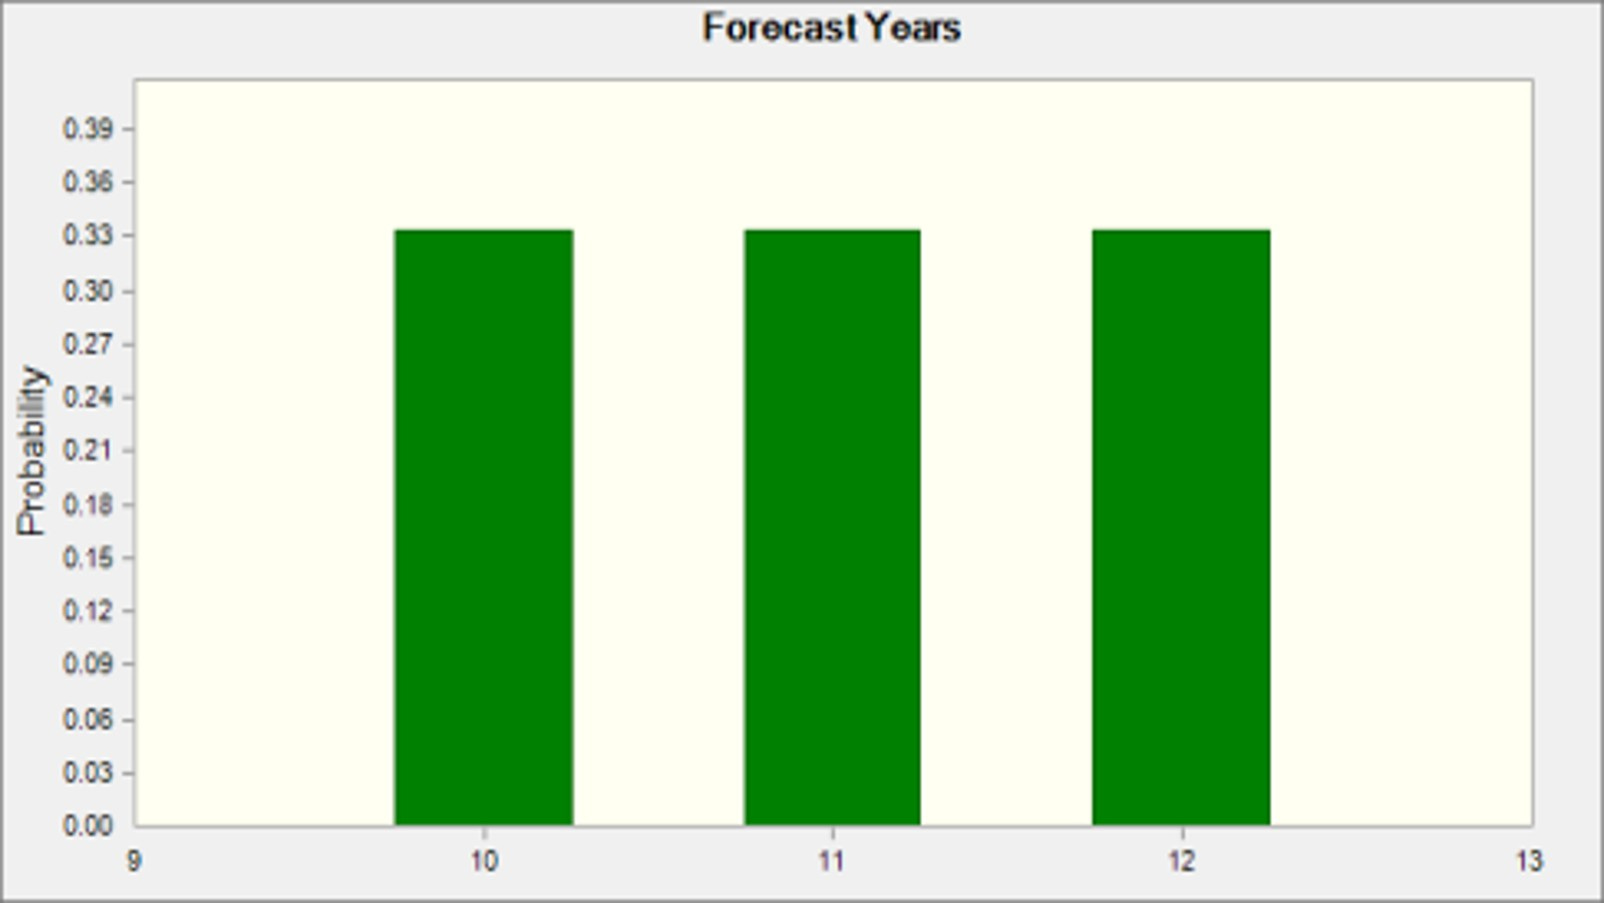
Forecast period is now a variable. Each run can simulate a different time horizon, from 1 to 30 years. Sensitivity analysis shows that this change can materially shift the outcome.
You can choose whether revenue growth stays constant or tapers down. For some businesses, constant growth makes more sense. For others, tapering is the only realistic option.
Implementing these changes took work. The forecast period has to dynamically update cash flows, reinvestment, and terminal value. With some help from AI, it now works.
Premium members can download the model at the end of this post. It runs at scale with the Crystal Ball add-in, but it’s usable manually too. As a reminder, we’re working to integrate it into Summit’s Analytics, so you won’t be stuck struggling with spreadsheets much longer.
Now that we have a working model, it’s time to put theory into practice.
Let’s look at how this model plays out across two stocks: Evolution and Novo Nordisk.
Evolution
For the first stock, I’ve chosen Evolution, the Swedish online casino provider. I believe it’s a strong case to showcase the power of Monte Carlo: the stock trades at a low multiple, yet the business fundamentals remain robust. Challenges still exist, but the company has proven resilient so far.
Here’s how the simulation was structured, using the four variables:
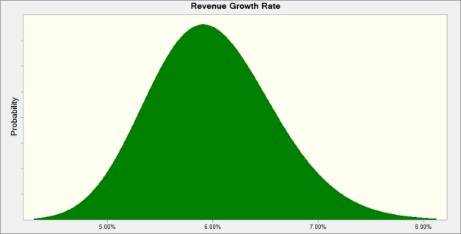
Revenue Growth Rate
Modeled with a lognormal distribution, centered around 6% with a location of 0% and standard deviation of 0.6%. In simple words: most runs cluster near 6% growth, with tails stretching from ~0% to ~8%.
Evolution has historically grown much faster. These are conservative assumptions.

Most runs assume revenue growth rate around 6%, with outliers to the up- and downside. Forecast Period
Uses a discrete uniform distribution from 10 to 15 years. Each time horizon is equally likely.
Operating Margin
Triangular distribution ranging from 50% (low), 55% (most likely), to 60% (high). Notably, Evolution has exceeded 60% margins in each of the last four years, peaking at 68%. The assumptions reflect some compression risk as U.S. expansion should ramp up.
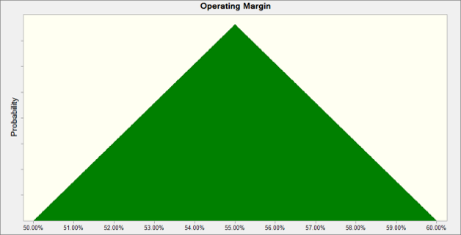
An operating margin around 55% is most likely, but any run can assume a margin of anywhere from 50-60%. Sales-to-Capital Ratio
Also triangular, with a range of 0.7 to 0.9 (most likely 0.8). For context, Evolution’s current ratio is ~0.6 and rising. Reinvestment is linked to this input, and overly conservative assumptions lead to extremely high and unrealistic capital expenditures, which is why I’ve made this slightly higher than it is today.

A sales-to-capital of 0.8 is most likely, but any run can assume a ratio of anywhere from 0.7 to 0.9.


Other key assumptions include:
A tax rate of 20%, elevated to reflect the new 15% tax rule and U.S. expansion.
A discount rate of 10%
A terminal growth rate of 2%
Results
From 10,000 simulation runs, the minimum value per share is €66.78 (~745 SEK) and the maximum €93.33 (~1,042 SEK). The mean value per share is €77.43 (~864 SEK).
Today, Evolution trades at ~753 SEK.
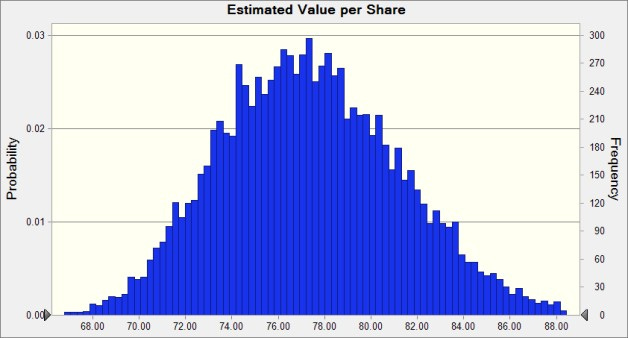
At current prices, Evolution trades near the bottom of the range. The distribution shows clear asymmetry: limited downside, meaningful upside.
And that’s why Monte Carlo is great. A single-point DCF might land near the mean. But it wouldn’t show you how much room there is to be wrong, or right.
Novo Nordisk
I’m keeping the Scandinavian theme going with Novo Nordisk, the diabetes and obesity giant that’s popular, dominant, and recently under pressure.
Unlike Evolution, where I used a constant revenue growth rate, here the model uses tapering growth. Novo is growing fast today, but it’s already huge. And 20% growth doesn’t last forever.
Specifically, here’s how the simulation was structured:
Revenue Growth Rate
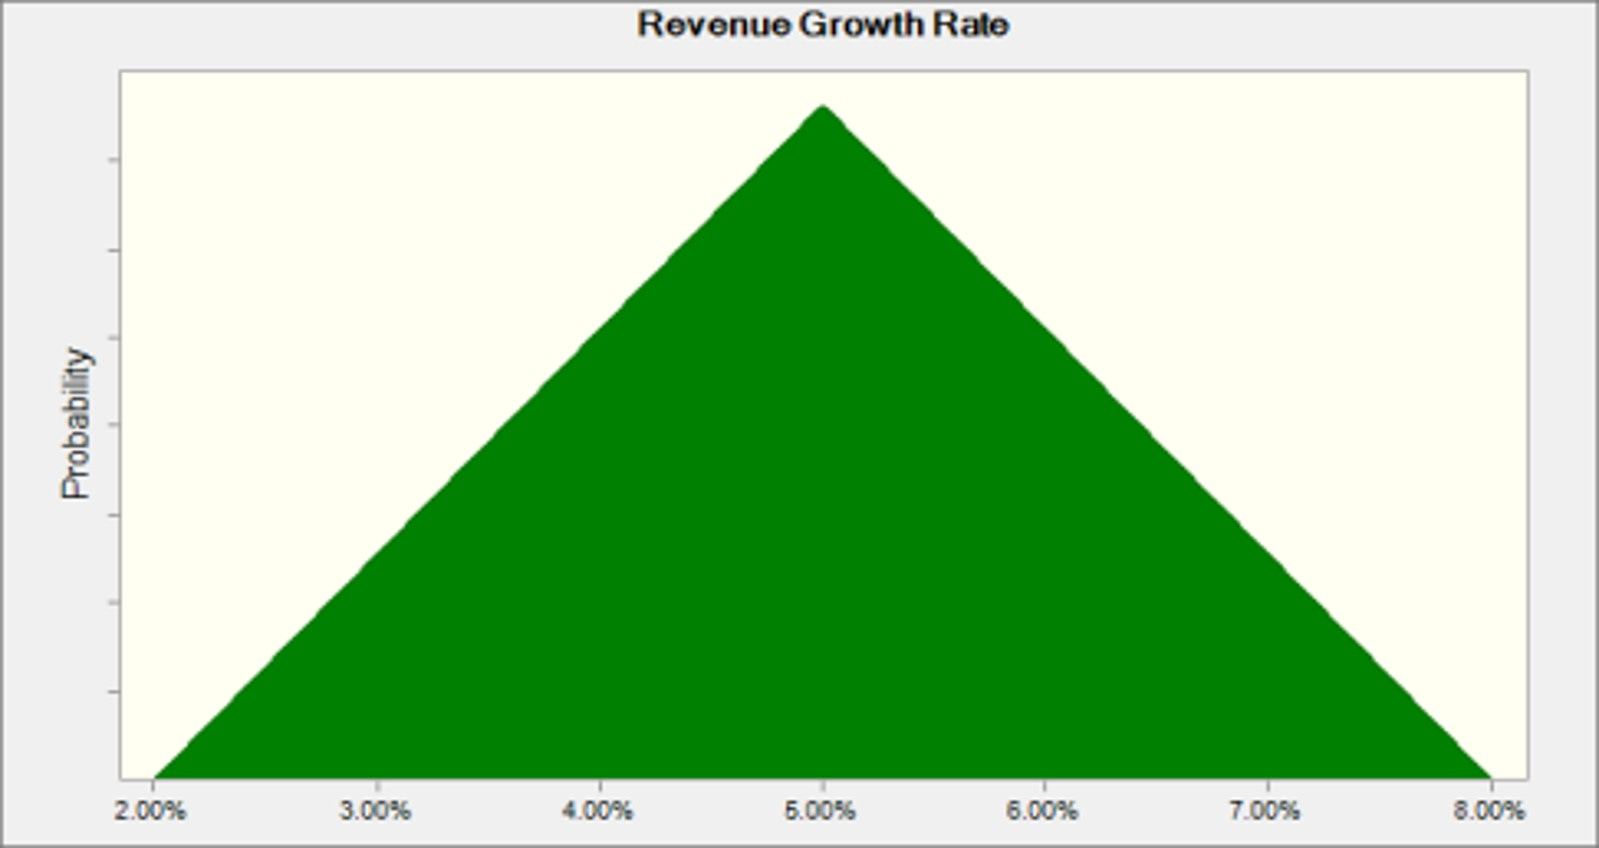
Always starts at 20% in year one, in line with management guidance. From there, it tapers to a final-year growth rate drawn from a triangular distribution: 2% minimum, 8% maximum, and 5% most likely.
With growth nearly guaranteed in the short term (as a result of a rapidly-growing industry), this variable has little impact on final value, which is the point.

Forecast Period
I narrowed the forecast range to 10-12 years (uniform distribution). With tapered revenue growth, a wider range makes this variable too dominant.
Operating Margin
Triangular distribution of 40% (low), 44% (most likely), and 48% (high). The margin currently hovers around 44% and has been rising.

Sales-to-Capital Ratio
Triangular distribution of 0.9 (low), 1.1 (most likely), and 1.3 (high). Sales-to-capital has historically hovered above 2, but dropped to 1.4 in 2024 due to heavy reinvestment. Revenue tends to lag investments.


Other key assumptions include:
A constant tax rate of 20% (5-year average)
A discount rate of 10%
A terminal growth rate of 2%
Results
From 10,000 simulation runs, the minimum value is 360 DKK, while the maximum is 622 DKK. The mean value is 490 DKK.
Today, Novo Nordisk trades at ~440 DKK.
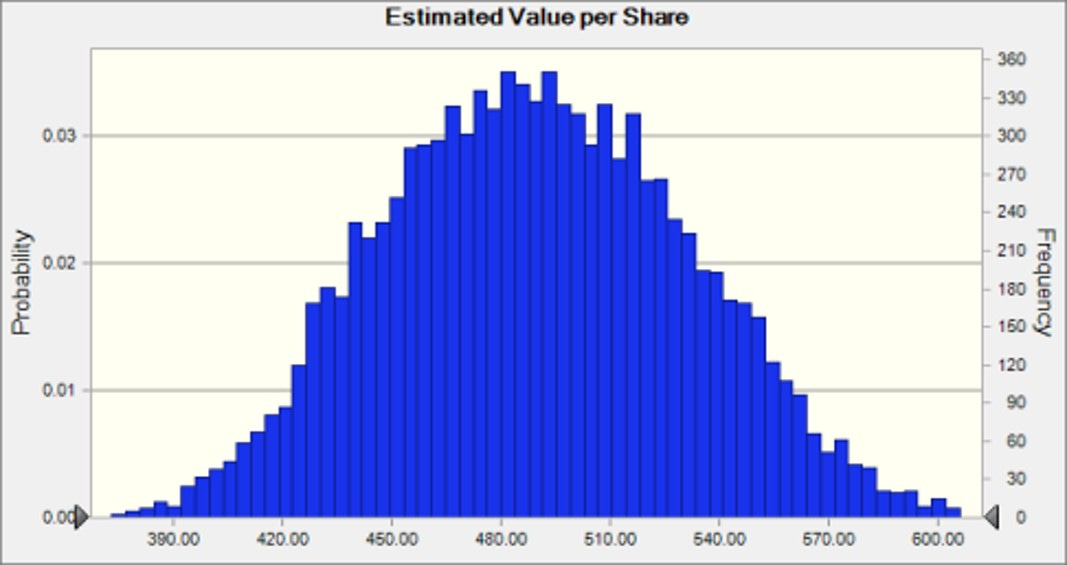
Interestingly, the 10th percentile of the distribution is 436 DKK, which is almost exactly where the stock trades today. That means 90% of simulated outcomes value Novo higher than its current price.
Like with Evolution, Monte Carlo reveals a clear setup: limited downside, meaningful upside. In other words, asymmetry.
The Big Point
Monte Carlo doesn’t give you one precise answer, but it gives you valuable context.
A traditional DCF might say Novo is worth 490 DKK. Monte Carlo says: that’s the average of 10,000 scenarios. And in 90% of those scenarios, it’s worth more than it is today.
It shows you that even under conservative assumptions, the downside is limited.
Same for Evolution. You’re essentially betting on a distribution skewed in your favor.
This is what valuation should look like: not guessing the future, but understanding what possible futures look like and how your assumptions shape it.
Premium members can find the Excel model below. Again, it’s not a fully functioning Monte Carlo model without Crystal Ball, but we’re soon adding a properly working model to the website so you can value stocks directly on the platform.
Because good investing isn’t about being exactly right. It’s about being approximately right, with the odds on your side.
